
Meet both of College Board's grade 11 benchmarks exactly and your PSAT/NMSQT total is 970. That score sits at the 48th percentile among students who actually took the test. The official definition of college ready lands you just below the middle of the field, which is the first and most useful thing to understand about what counts as a good PSAT score.
Scores from the autumn 2026 administration are released on 22 October, 5 November or 12 November, depending on when your school returned its answer sheets. When the report opens it shows a total, two section scores, two different percentiles and a Selection Index, and those numbers disagree with each other by design. The same student can read 99 on one percentile line and 96 on the next.
This post explains which number answers which question: what the benchmarks measure, why there are two percentile columns, and why your section split tells you more than your total ever will. For the National Merit side of the report, our guide to the National Merit Selection Index covers the formula and the cutoffs in full.
Key takeaways
- The grade 11 benchmarks are 460 Reading and Writing and 510 Math. Meeting both exactly totals 970, which is the 48th percentile of test takers.
- College Board defines a benchmark as a 75 per cent chance of earning at least a C in a related first-semester college course. It is a coping floor, not a competitive score.
- Your report carries two percentiles. The nationally representative one is higher because it includes students who never sat the test.
- The nationally representative percentile reads 99+ from 1450 upward, so it cannot tell 1450 apart from 1520.
- Two students can both total 970 with completely different readiness, because a total hides which section is short.
What is a good PSAT score in 2026?
There are three honest answers, and they are far apart. Meeting both College Board benchmarks takes 970. Sitting mid-field among test takers takes about 1010. Being nationally competitive takes 1400, which is the 96th percentile of test takers.
Here is the grade 11 picture using College Board's own published percentiles, with both comparison groups side by side.
| Total score | Nationally representative | User (test takers) | What it tells you |
|---|---|---|---|
| 1520 | 99+ | 99+ | Maximum possible PSAT total |
| 1450 | 99+ | 98 | Top 2 per cent of test takers |
| 1400 | 99 | 96 | Nationally competitive |
| 1300 | 96 | 91 | Top tenth of test takers |
| 1200 | 90 | 82 | Top fifth of test takers |
| 1100 | 79 | 69 | Comfortably above the benchmarks |
| 1000 | 59 | 53 | Roughly mid-field |
| 970 | 53 | 48 | Both benchmarks met exactly |
| 900 | 37 | 36 | Below both benchmarks |
The PSAT total runs from 320 to 1520 and each section runs from 160 to 760. The ceiling is lower than the SAT's 1600 because the test does not include the hardest material, so a 1520 is not a weaker 1600. It is the top of a shorter ladder.
The benchmarks measure something narrower than you think
A benchmark is not a target. College Board states that students whose Reading and Writing section score meets or exceeds the benchmark "have a 75% chance of earning at least a C in first-semester, credit-bearing college courses in history, literature, social sciences, or writing", with the same wording applied to algebra, statistics, precalculus and calculus for Math.
Read that carefully. It describes a three-in-four chance of a C in an introductory course. Nothing in it says anything about selective admission, scholarships or whether your score will impress anyone. A student who clears both benchmarks and stops there has evidence they can survive first-year coursework, which is worth knowing and is not the same as a good score.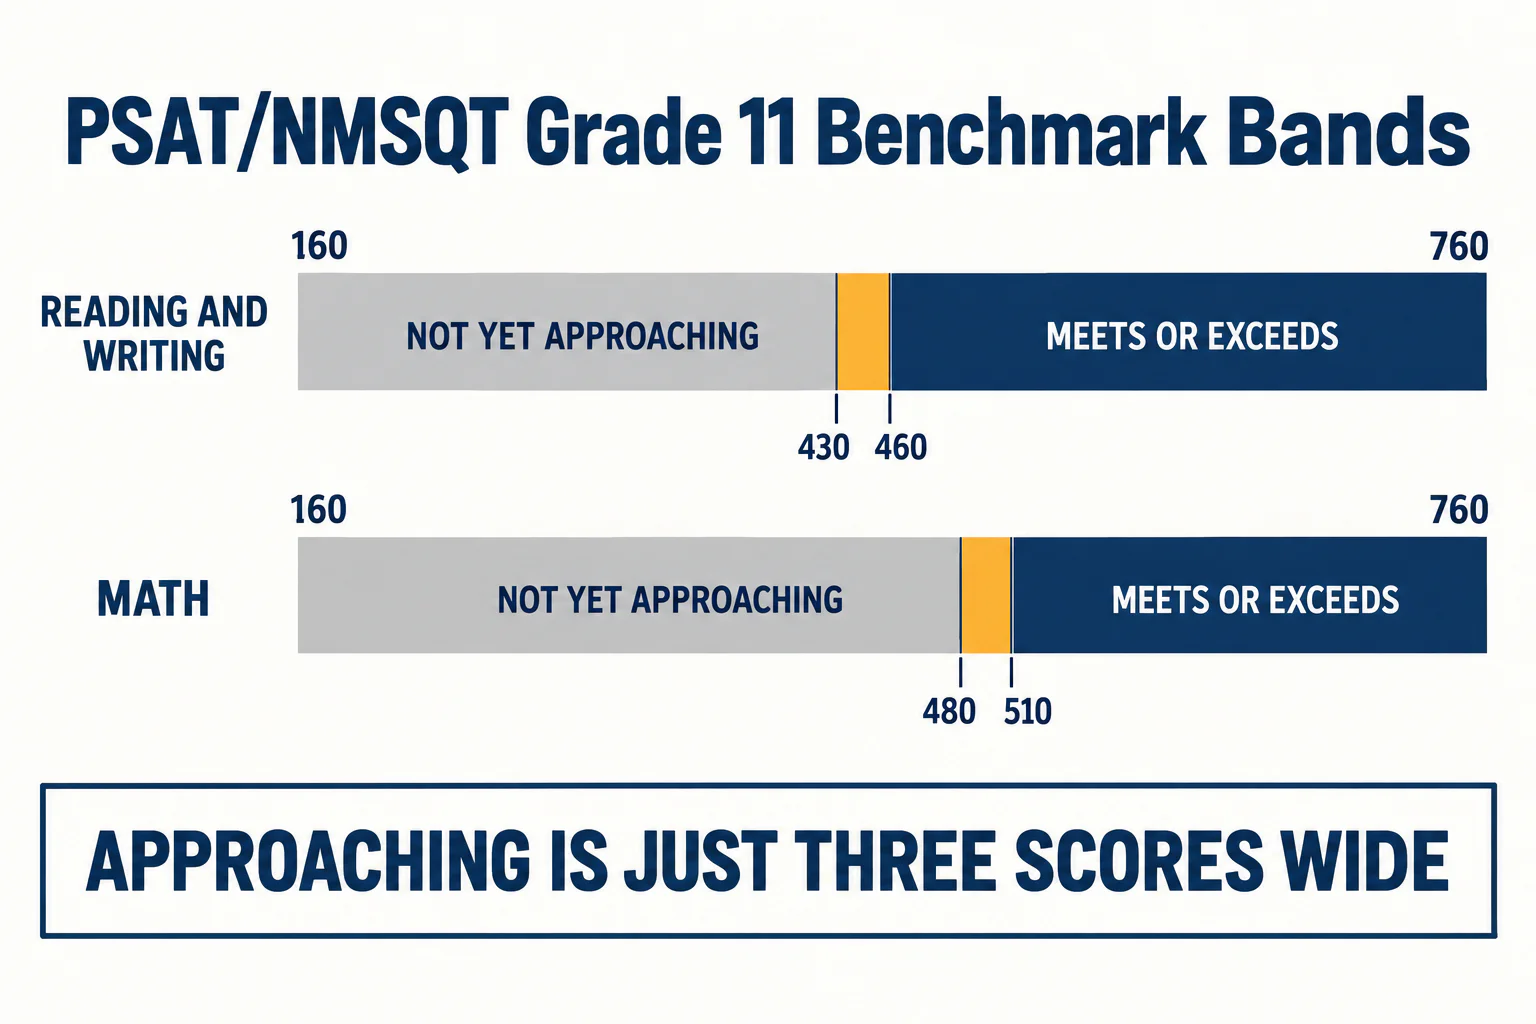
Reading and Writing: the benchmark is 460
College Board splits the 160 to 760 section scale into three bands for grade 11. Not Yet Approaching runs 160 to 420, Approaching runs 430 to 450, and Meets or Exceeds runs 460 to 760. Section scores move in steps of 10, so the Approaching band covers exactly three possible scores: 430, 440 and 450. The gap between approaching the benchmark and meeting it is roughly one or two questions.
Math: the benchmark is 510, and it is the harder one
The Math bands sit higher. Not Yet Approaching runs 160 to 470, Approaching runs 480 to 500, and Meets or Exceeds runs 510 to 760. Because the Math benchmark is 50 points above the Reading and Writing benchmark, a student with evenly balanced section scores will usually clear the verbal benchmark first and miss the Math one. That pattern is extremely common and it is a scoring artefact, not a sign that the student is bad at maths.
Why does your report show two different percentiles?
Because College Board calculates two, against two different groups of students. The nationally representative percentile comes from a research study of US students in your grade, weighted to represent all of them "regardless of whether they typically take the PSAT/NMSQT". The user percentile is based on the actual scores of students who sat the test in the past three school years.
The first group includes teenagers who have never opened a practice test. The second group is the one you are competing with. So the nationally representative number is almost always higher, and it is the one students quote.
That ceiling matters for anyone near the top. Three different scores, 1450, 1500 and 1520, all return the same nationally representative label. A student using that column to decide whether to keep pushing has no information left to work with, while the user column still separates 98 from 99+. Use the stricter number.
Not sure where your teen stands? A free consultation with Catalyst Test Prep maps exactly which SAT topics need the most work, so you're never guessing about study time.
Book a Free Consultation →Your section split matters more than your total
A total is two numbers added together, and addition throws away the thing you need. Take 970, the score that meets both benchmarks exactly, and build it three ways.
- 460 Reading and Writing plus 510 Math. Both benchmarks met, exactly.
- 600 Reading and Writing plus 370 Math. Verbal benchmark cleared by 140 points, Math benchmark missed by 140.
- 410 Reading and Writing plus 560 Math. Math cleared comfortably, Reading and Writing missed.
All three students report a 970 and a 48th percentile. One is on track in both subjects, one needs most of a year of maths, and one needs reading work. A parent told only the total has learned almost nothing about what to do next.
Did you meet both benchmarks or only one?
This is the question to answer before any other. Compare each section score with its own benchmark, 460 and 510, and write down the gap. The larger of the two gaps is where the next eight months should go. If you want to see how those section scores translate onto the full SAT scale, the Digital SAT score calculator works on the same 160 to 760 sections.
Where National Merit fits, and where it does not
National Merit does not use your total at all. It uses the Selection Index, which doubles the Reading and Writing score, adds the Math score and divides by 10, producing a number between 48 and 228. Only a grade 11 PSAT/NMSQT enters the competition.
Because that formula weights one section twice, it answers a different question from the one this post is about, and it rewards a different score shape. The national Commended threshold for the 2027 programme was a Selection Index of 208, and over 1.3 million juniors entered that competition. The full mechanics, including why your state's cutoff cannot be known in advance, are in our guide to the Selection Index. Treat it as a separate scoreboard rather than a verdict on whether your PSAT score was good.
What should you do in the eight months after scores land?
Work on the section with the bigger benchmark gap, and start while the report is still fresh. Scores arrive between 22 October and 12 November, and the spring SAT dates sit six to eight months later, which is a genuinely long runway if it is spent on the right material.
If both sections cleared their benchmarks
Move the goal from benchmarks to percentiles. The jump from 1100 to 1200 moves you from the 69th to the 82nd user percentile, which is the widest percentile gain available anywhere on the scale for 100 points of work. Above 1300 each 100 points buys less, so the middle of the range is where effort converts fastest.
If one section missed its benchmark
Spend most of the available time there and accept that the stronger section will drift slightly. A student 140 points below the Math benchmark does not need a general study plan. They need the specific content domains they lost points in, which the score report breaks down into four Reading and Writing areas and four Math areas.
If you are chasing 1400 and above
Switch from the nationally representative column to the user column, because the first one has already stopped measuring you. Our guide to breaking the 1400 to 1500 barrier covers what changes at that level, and the honest answer is that accuracy on mid-difficulty questions matters more than drilling rare hard ones.
Good PSAT scores in grade 10
The grade 10 benchmarks are lower, at 430 for Reading and Writing and 480 for Math, totalling 910. A sophomore meeting both is where College Board expects them to be, with another year of school still to come.
Only the grade 11 PSAT/NMSQT enters National Merit, so a 10th-grade score carries no scholarship consequence whatsoever. That makes it the most valuable score report a student will ever receive, because it is pure diagnosis with two full years left to act. The differences between the tests are covered in PSAT 10 vs PSAT/NMSQT, and if your scores have not appeared yet, when PSAT scores come out explains the three release dates.
The short version
A good PSAT score is not one number. The benchmarks, 460 and 510, mark the point where College Board expects you to cope with an introductory college course, and meeting both puts you at the 48th percentile of test takers rather than near the top. The two percentile columns on your report measure you against two different populations, and the flattering one stops working above 1450. Your section split, not your total, tells you what to do in the months before your SAT.
Read the two section scores first, compare each with its own benchmark, and put the time where the gap is biggest.
Ready to turn a prep plan into real score gains? Catalyst's 1:1 live online SAT programme starts with a free consultation to benchmark your teen's starting point and build a personalised path to their goal score.
Book a Free ConsultationSources checked against College Board's published benchmark tables and its PSAT/NMSQT percentile research tables, and against the National Merit Scholarship Corporation's own programme documents, on 21 October 2026. Benchmark figures are from College Board's benchmarks page and percentiles from College Board Research.