
ACT sets the Math score that signals readiness for first-year college algebra at 22. In the graduating class of 2025, 29% of students reached it. The national average Math score that year was 18.9.
That gap is why this question is harder than it looks. A good ACT score is not the average score, and it is not really a single number. It is three separate questions wearing one coat: where you sit against other test takers, whether you clear the thresholds ACT itself publishes, and whether your score actually helps at the colleges on your list.
This guide answers all three using figures pulled from ACT's own documents this month. It also covers something most score guides have not caught up with. The ACT Composite changed how it is calculated, your score report does not say which version you received, and the margin of error on the number went up.
Key Takeaways
- The mean Composite on the current national table is 19.1 and the median is 18. A 20 already places you above 63% of test takers.
- ACT's readiness benchmarks sit well above average: 18 English, 22 Math, 22 Reading, 23 Science. Only 20% of the class of 2025 met all four.
- The Composite is now the average of English, Math and Reading only. Science is reported separately and no longer feeds into it.
- A 30 is not one thing. A 30 in Math is the 95th percentile; a 30 in Reading is the 89th.
- Published college score ranges describe students who enrolled and chose to submit, which biases them upward. Read them as target bands, not cutoffs.
What counts as a good ACT score in 2026?
Against the national field, a Composite of 24 or higher is a good score: it beats four out of five test takers. The table below is ACT's own National Ranks table for the 2026-2027 reporting year, which covers score reports issued from September 2026 through August 2027 and is built from the ACT-tested graduating classes of 2024, 2025 and 2026.
| Composite | National rank (percentile) | What it means |
|---|---|---|
| 36 | 100 | Perfect |
| 34 | 99 | Top 1%, in range at the most selective colleges |
| 32 | 97 | Strongly competitive nationally |
| 30 | 94 | Top 6% |
| 28 | 91 | Top 10% |
| 26 | 86 | Comfortably above average |
| 24 | 80 | Beats four in five test takers |
| 22 | 72 | Above average |
| 20 | 63 | Above average, and above the mean of 19.1 |
| 18 | 52 | The median score |
| 16 | 41 | Below average |
| 14 | 28 | Bottom third |
Notice something in that table that catches people out. The mean Composite is 19.1, but a 19 ranks at the 58th percentile and the 50th percentile falls at 18. The average score is higher than the middle score, because the distribution has a long tail at the bottom. So "I got an average score" and "I beat half the people who sat it" are two different statements, and the second one is true at a lower number than most students expect. The same arithmetic applies on the other test, which we cover in what counts as a good SAT score.
ACT's own readiness benchmarks sit in the top quarter
Percentiles tell you about the crowd. They say nothing about whether you are prepared. ACT publishes a separate and more demanding answer in its national profile report: the College Readiness Benchmarks, defined as the minimum section score indicating "a 50% chance of obtaining a B or higher or about a 75% chance of obtaining a C or higher" in the matching first-year college course. These were derived from how students actually went on to perform, not chosen for neatness.
| College course | Section | Benchmark | Class of 2025 who met it | Percentile of the benchmark |
|---|---|---|---|---|
| English Composition | English | 18 | 50% | 54th |
| Algebra | Mathematics | 22 | 29% | 74th |
| Social Sciences | Reading | 22 | 39% | 66th |
| Biology | Science | 23 | 30% | 77th |
| STEM courses | STEM | 26 | n/a | 88th |
Read the right-hand column again. Three of the four subject benchmarks sit in the top third of the distribution, and the Math benchmark of 22 is the 74th percentile. The score ACT calls the floor for being ready is, for three subjects out of four, a score most test takers do not reach.
Across all four sections, 20% of the ACT-tested class of 2025 met every benchmark. That is one student in five, out of 1,380,130. The figure was 25% in 2021, then 22%, 21%, 20%, and 20% again in 2025. The average Composite over the same five years went 20.3, 19.8, 19.5, 19.4, 19.4.
This is the single most useful reframing available on this question. If your target is "a good score", the crowd says 24 and the test's publisher says you need 22 in Math and 23 in Science just to be ready for the first year of college. Those are different goals, and the second one is harder.
Your Composite now averages three sections, not four
The enhanced ACT made the Science section optional, which forced a change to the Composite. On the legacy test the Composite was the rounded average of English, Math, Reading and Science. On the enhanced test it is the rounded average of English, Math and Reading. ACT's guidance for schools and colleges sets this out directly.
| Legacy ACT | Enhanced ACT | |
|---|---|---|
| Composite formula | (E + M + R + S) ÷ 4 | (E + M + R) ÷ 3 |
| Science | Required, inside the Composite | Optional, reported separately |
| STEM score | Average of Math and Science | Unchanged, if Science is taken |
| Test length | Full | Up to a third shorter without Science |
Three consequences follow, and all three affect how you read a score.
The two versions concord point for point. ACT established an equipercentile concordance and found that above a Composite of 13 the closest enhanced score to any legacy score is the same number, with a correlation of 0.99. No conversion table is needed. Below 14 the concordance was not estimated, because too few students scored there to be reliable.
You cannot tell from your report which formula produced your number. ACT is explicit: a student receives one Composite score, and there is no label saying which version it is. You work it out from the test date. Online national administrations from April 2025, and all administrations from September 2025, use the three-section Composite. ACT projected that 0.3% of the class of 2025 would have one, 33.5% of the class of 2026, and 98.9% of the class of 2027.
A strong Science score no longer lifts your Composite. If Science is your best subject, that strength now has to travel through the STEM score and the section score instead. The superscore changed with it, and no longer includes Science. Our guide to how ACT superscoring works covers the mechanics, and whether to sit the optional Science section works through the decision itself.
Not sure where your teen stands? A free consultation with Catalyst Test Prep maps exactly which ACT sections need the most work, so you're never guessing about study time.
Book a Free Consultation →Is a 30 in Reading the same as a 30 in Math?
No, and the difference is bigger than most students realise. The same number sits at a different place in the population depending on which section it came from, because the four sections have different means and different spreads.
| Section score | English | Math | Reading | Science |
|---|---|---|---|---|
| 30 | 93rd | 95th | 89th | 95th |
| 24 | 81st | 81st | 75th | 82nd |
| 22 | 74th | 74th | 66th | 70th |
| 18 | 54th | 60th | 47th | 48th |
| Mean / SD | 18.4 / 7.0 | 19.0 / 5.7 | 20.0 / 7.1 | 19.5 / 5.8 |
Reading has both the highest mean and the widest spread, so a Reading score buys you fewer percentile points than the identical number in any other section. A 22 in Reading is the 66th percentile; a 22 in Math is the 74th. Math is the most compressed section, with a standard deviation of 5.7 against Reading's 7.1, which is why Math scores move percentile quickly in the middle of the range and why a weak Math score falls so far so fast.
For the Composite, though, all three contributing sections weigh exactly the same. That has a practical consequence worth acting on: the cheapest Composite point is in whichever section is furthest below its own benchmark, not in whichever subject you feel weakest at. Those are often not the same section. If you want to put real numbers on your own profile, the ACT score calculator will show you what a section gain does to the Composite.
What is a good ACT score for your college list?
This is the only version of the question with a real answer, and it has nothing to do with the national average. A good ACT score is one that sits at or above the 75th percentile of the enrolled students at the most selective college you are seriously applying to. The figures below come from the 2024 reporting year of the College Scorecard, the federal dataset institutions file themselves.
| University | ACT middle 50% | Admission rate |
|---|---|---|
| Harvard University | 34 to 36 | 3.7% |
| Massachusetts Institute of Technology | 34 to 36 | 4.6% |
| Duke University | 34 to 35 | 5.7% |
| Georgia Institute of Technology | 30 to 34 | 14.1% |
| University of Georgia | 29 to 34 | 37.7% |
| University of Colorado Boulder | 29 to 33 | 78.1% |
| Clemson University | 28 to 32 | 38.3% |
| University at Buffalo | 27 to 32 | 74.2% |
| Texas A&M University | 25 to 31 | 57.4% |
| University of Alabama | 24 to 31 | 76.7% |
| University of Kansas | 20 to 28 | 93.5% |
Put two rows of that table side by side and the whole idea of one good score falls apart. Colorado Boulder admits 78% of its applicants and reports a middle 50% of 29 to 33. Kansas admits 93% and reports 20 to 28. A 28 is at the very top of one range and at the very bottom of the other, at two universities that both accept the large majority of people who apply.
That is not a contradiction, and it is the most important thing to understand about these numbers. A published range describes students who enrolled and chose to submit a score. Where submitting is optional, the students who submit are the ones whose scores help them, so the reported band drifts upward and stops describing the admitted class. Some institutions also file derived rather than observed figures, so treat any single row as approximate. Use the range to set a target band, never as a cutoff, and check each college's own testing page for whether it wants a score at all. For a worked example across one conference, see our breakdown of average SAT and ACT scores at all 18 Big Ten schools.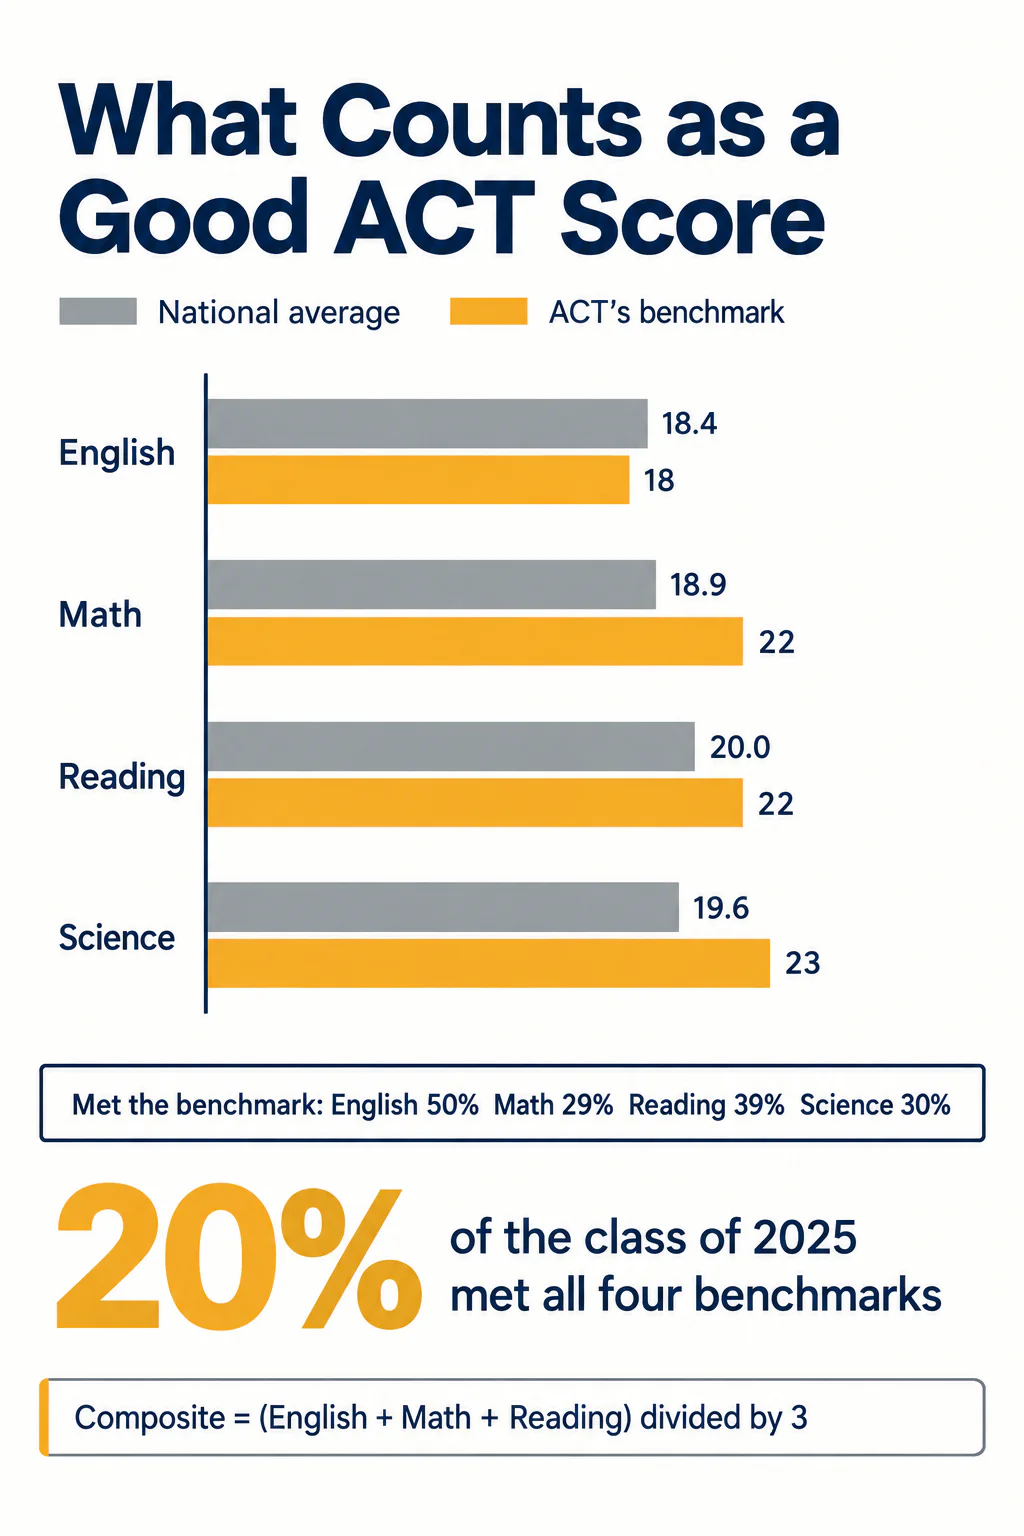
One point is now inside the test's margin of error
Shortening the test cost a little precision, and ACT measured how much. Section reliability fell from a range of 0.89 to 0.94 on the legacy form to 0.84 to 0.88 on the enhanced forms, which is still well above the 0.80 that testing practice treats as acceptable. The number that matters more is the standard error of measurement on the Composite: it rose from 1.03 on the legacy form to about 1.32 and 1.35 on the two enhanced forms used in the linking study.
In plain terms, your reported Composite is an estimate with roughly a point and a third of wobble on either side. A student who scores 27 one Saturday and 28 the next has probably not improved at all. Chasing a single point is chasing noise, and it is the most common way students waste a retake. Set a three-point target band instead and aim at the middle of it.
Two more measured effects are worth knowing. ACT expects average Composites to fall by roughly 0.1 to 0.4 points under the three-section formula, driven by a slight thickening at the bottom of the distribution, which is well inside normal year-to-year variation. And if every student took Science, more than 90% would land within one point of the Composite the old formula would have given them. The change is real but small, and it is not a reason to re-evaluate a score you already have. When you are judging a practice test rather than a real one, our guide on estimating an ACT score from a practice test explains why raw-to-scale conversion adds error of its own on top of this.
What to do with the score you have
Four bands, and a different next move in each.
- Below 18. You are below the median and below three of the four benchmarks. The gain available here is the largest of any band, because the questions you are missing are the ones most students get right. Start with content, not test strategy.
- 18 to 23. You have cleared English and are short of the Math and Reading benchmarks at 22. This is where a diagnostic earns the most, because the fastest route to a higher Composite is usually a section you have not identified yourself.
- 24 to 29. Above four in five test takers and in range at most state universities. Gains slow here and come from accuracy under time rather than new material. Decide whether a retake or a stronger application elsewhere is the better use of the autumn.
- 30 and above. Top 6%. Check each target college's reported range before retaking at all; above the 75th percentile of your list, more points buy very little. Scholarship thresholds, not admission, are usually the reason to keep going.
Setting a target you can defend
A good ACT score is the one that does a job for you. Against the national field, 24 clears four in five test takers and 30 clears 94%. Against ACT's own definition of ready, you need 22 in Math and 23 in Science, which only 29% and 30% of the class of 2025 reached. Against your college list, the only number that counts is the 75th percentile of the most selective school you are serious about.
Work out those three numbers for your own situation, take the highest one, and build backwards from it section by section. Remember that the Composite now averages three sections equally, so the cheapest point is wherever your gap to the benchmark is widest.
Ready to turn a prep plan into real score gains? Catalyst's 1:1 live online ACT programme starts with a free consultation to benchmark your teen's starting point and build a personalised path to their goal score.
Book a Free Consultation