
SAT to ACT score conversion is a solved problem. ACT and College Board built the tables together, published them jointly, and admissions offices use them. The full table is below and you can read your answer off it in ten seconds.
What almost no converter tells you is the date on it. ACT's own concordance page states that the most recent tables "were released in 2018 and are not updated annually". They were built from students who sat the tests in 2016 and 2017, which means they predate the digital SAT and they predate the shortened ACT. That does not make them wrong, and it does change how much weight a single concorded point deserves.
Key Takeaways
- A 1400 SAT concords to an ACT 31, a 1200 to a 25, and a 1040 to a 20. The full table is below.
- The official tables were released in 2018 and built from 589,753 students who sat both tests between early 2016 and June 2017.
- Each score maps to a range, not just a point, and the ranges are uneven: one ACT point can be worth 20 SAT points in one place and 40 in another.
- The two directions are not perfect mirrors, so converting across and back can move you by a point.
- College Board and ACT state plainly that a concorded score "is not a perfect prediction" of performance on the other test.
The official ACT to SAT conversion table
This is Table A2 from the official concordance, which maps each ACT Composite score to a single best SAT Total and to the SAT range it covers.
| ACT Composite | SAT Total (single point) | SAT range |
|---|---|---|
| 36 | 1590 | 1570–1600 |
| 35 | 1540 | 1530–1560 |
| 34 | 1500 | 1490–1520 |
| 33 | 1460 | 1450–1480 |
| 32 | 1430 | 1420–1440 |
| 31 | 1400 | 1390–1410 |
| 30 | 1370 | 1360–1380 |
| 29 | 1340 | 1330–1350 |
| 28 | 1310 | 1300–1320 |
| 27 | 1280 | 1260–1290 |
| 26 | 1240 | 1230–1250 |
| 25 | 1210 | 1200–1220 |
| 24 | 1180 | 1160–1190 |
| 23 | 1140 | 1130–1150 |
| 22 | 1110 | 1100–1120 |
| 21 | 1080 | 1060–1090 |
| 20 | 1040 | 1030–1050 |
| 19 | 1010 | 990–1020 |
| 18 | 970 | 960–980 |
| 17 | 930 | 920–950 |
| 16 | 890 | 880–910 |
| 15 | 850 | 830–870 |
| 14 | 800 | 780–820 |
| 13 | 760 | 730–770 |
| 12 | 710 | 690–720 |
| 11 | 670 | 650–680 |
| 10 | 630 | 620–640 |
| 9 | 590 | 590–610 |
Going the other way, the SAT to ACT table works in ten-point SAT steps. An SAT of 1250, 1240 or 1230 all concord to an ACT 26. An SAT of 1220, 1210 or 1200 all concord to a 25. The middle value in each group carries an asterisk in the original, marking it as the score to use when a single-point comparison is needed.
Why does the table use ranges instead of a formula?
Because the relationship is not linear and the tables are honest about it.
Look down the range column and the widths move around. Several ACT scores cover about thirty SAT points. Several cover about twenty. A few in the lower middle of the scale cover about forty. There is no constant you can multiply by, which is why the official document publishes two tables rather than an equation.
This has a practical consequence that trips students up. Convert an SAT score to an ACT score using one table, then convert that ACT score back using the other, and you may not land where you started. The tables are built from the same data and are provided in both directions, and the two directions round differently. Neither answer is wrong. They are answers to slightly different questions.
So if two online converters disagree with each other by a point, the likeliest explanation is that they implemented different directions of the same official table, rather than that one of them is broken.
What the data behind the table actually is
Worth knowing, because it tells you how much confidence the number deserves.
The 2018 tables were produced by researchers at College Board and ACT working together, in collaboration with the NCAA Technical Advisory Board. They used 589,753 students who were graduating seniors in 2017 and who had taken both the ACT and the then-new SAT, with the ACT sittings from February 2016 onward and the SAT sittings from March 2016 onward, through to June 2017. The sample was statistically weighted to reflect the demographics, school attributes and high school GPA of the population likely to take either test.
That is a serious piece of work on a very large sample. It is also a photograph of a particular moment. The document's own framing is careful: "A concorded score is not a perfect prediction of how a student would perform on the other test."
Not sure where your teen stands? A free consultation with Catalyst Test Prep maps exactly which SAT topics need the most work, so you're never guessing about study time.
Book a Free Consultation →The caveat the converters leave out
Both tests have changed since that data was collected.
The SAT moved to a digital, section-adaptive format delivered in Bluebook. The ACT was restructured into a shorter test with fewer questions, more time per question, and science made optional and removed from the Composite. The students in the concordance sample sat neither of those tests.
ACT's concordance page states that the 2018 tables are the most recent and are not updated annually. It does not say whether they have been revalidated against the current formats. That is the honest position to report, and it is more than almost any conversion tool will tell you.
What follows from it is modest and useful:
- Trust the table at the band level. A 1400 and a 31 are genuinely comparable scores. That much is solid.
- Do not trust it at the single-point level. If your two concorded scores differ by one ACT point or ten SAT points, treat them as equal and decide on other grounds.
- Use the college's own data where you can. Colleges publish both SAT and ACT ranges separately, so compare like with like instead of converting.
That last point is the strongest move available and almost nobody makes it. If a college publishes a middle 50% range for each test, you do not need a concordance at all. Compare your SAT against their SAT range and your ACT against their ACT range, and submit whichever sits higher relative to its own range.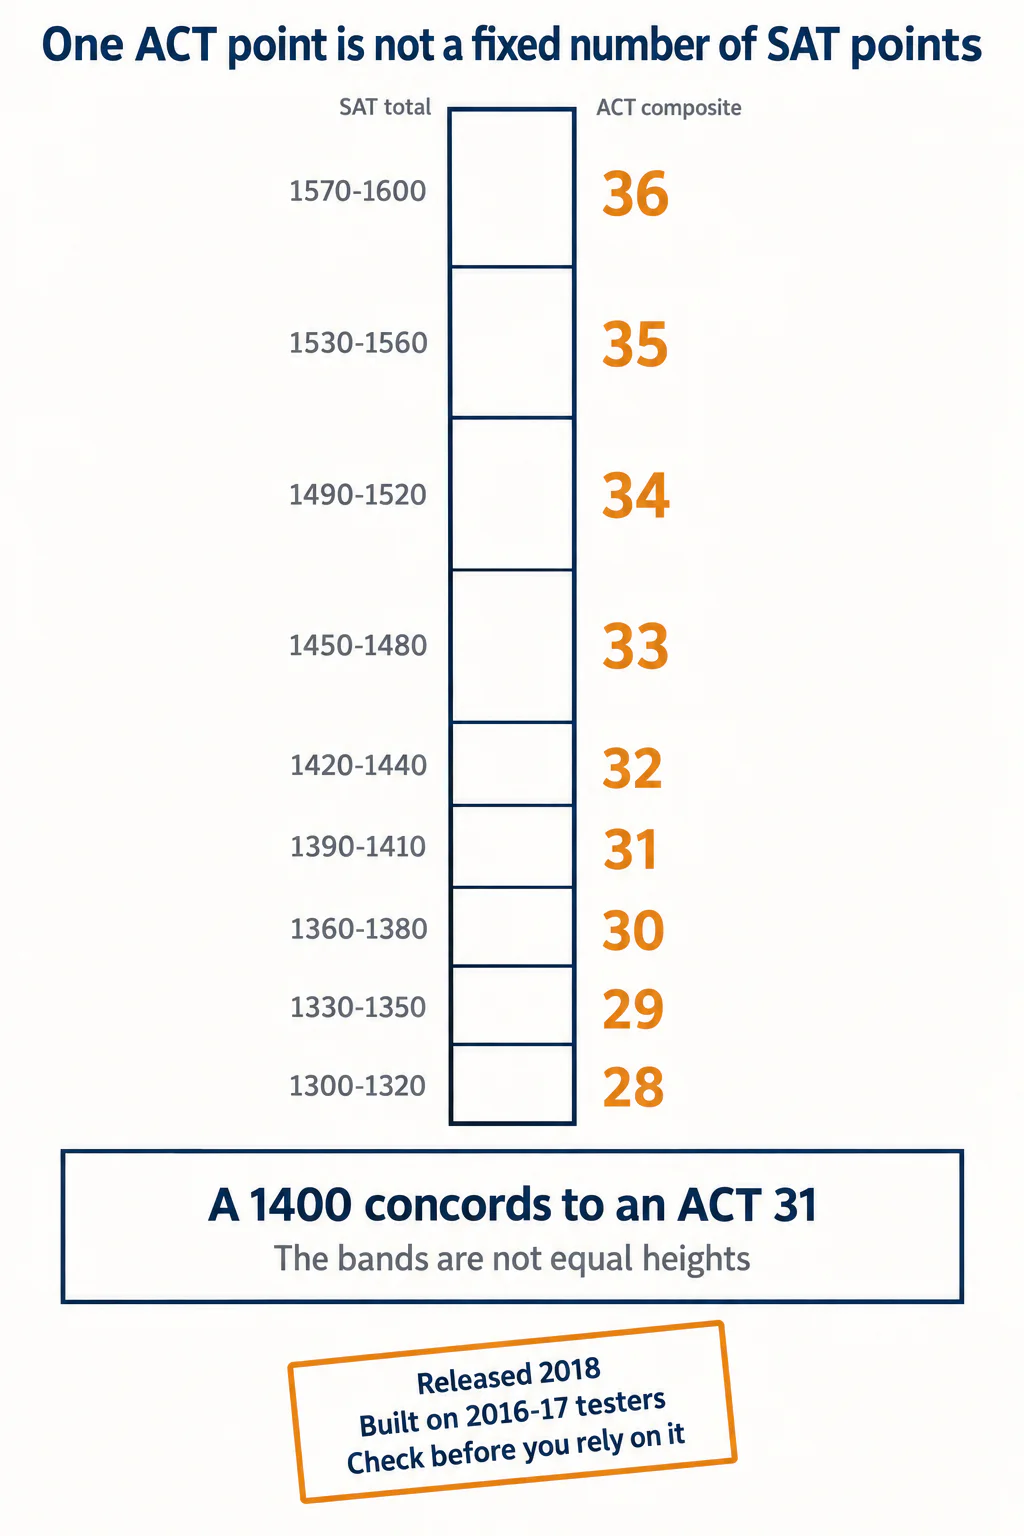
How should you use a concorded score?
There are really only three decisions it helps with.
- Which score to submit. Concord both, compare each against the relevant published range, submit the stronger. If they tie, submit either and stop thinking about it.
- Which test to prepare for. If you have sat both and one concords higher, that is usually the test to commit to. Pacing and question style explain most of the gap, and those are stable traits rather than knowledge you can top up.
- Whether a retake is worth it. Work out what score you need on the test you are keeping, convert the gap, and ask whether that much movement is realistic in the time left.
What it does not help with is a choice you have not tested. Deciding between the SAT and the ACT from a conversion table is backwards, because the table tells you how scores compare and not how you compare. Our breakdown of whether the SAT or the ACT is better for you covers the structural differences that actually determine which one suits a given student, and our comparison of SAT and ACT reading goes into the single biggest divergence between the two.
Two more things worth factoring in before you commit. The ACT's science section is now optional and sits outside the Composite, which changes the arithmetic of an ACT retake considerably. And ACT superscoring works differently from the SAT equivalent, so the number a college ends up reading may not be the number on any single report.
If you want to convert a raw practice-test result into a scaled score before concording it, the SAT score calculator and the ACT score calculator will do that step.
Section concordances exist too
The official document carries three sets of tables, not one. Alongside ACT Composite against SAT Total, there are tables for ACT Mathematics against SAT Math, and for ACT English plus Reading combined against SAT Evidence-Based Reading and Writing.
The section tables are more useful than the composite one for diagnosis. A student whose maths concords two points above their English is telling you where the preparation should go, and a total score hides that completely. One footnote worth knowing: the Composite concordances were derived from concordances of the ACT sum score rather than the rounded Composite, which is a small technical reason not to over-read a single point.
Use the table for what it is. It is a well-built bridge between two scales, published by the organisations that own them, and old enough that you should walk across it rather than run.
Ready to turn a prep plan into real score gains? Catalyst's 1:1 live online SAT programme starts with a free consultation to benchmark your teen's starting point and build a personalised path to their goal score.
Book a Free ConsultationTables and sample details are taken from the Guide to the 2018 ACT/SAT Concordance, and the statement about release date comes from ACT's own concordance page.