

A good PSAT 8/9 score is not a number you can look up once. It depends on which grade your child was in on test day, and the difference is large enough to flip the verdict. A Math section score of 435 is printed as Meets or Exceeds for an eighth grader and as Approaching for a ninth grader. Same test, same 120 to 720 scale, same digits on the page, two different conclusions.
That single fact is the one most families miss, and it changes what the score report is for. The PSAT 8/9 is not scored against other children in the room. It is scored against where your child needs to be this year to still be on track for the SAT in three or four years. Below are the real benchmark numbers from College Board, what the national average actually is, and the three things worth doing in the fortnight after the report arrives.
Key Takeaways
- The benchmarks are 390 and 430 in grade 8, and 410 and 450 in grade 9, for Reading and Writing and Math respectively. They are set per section, never on the total.
- A score of 430 to 440 in Math clears the bar in grade 8 and misses it in grade 9. Read the report against your child's grade, not against the previous year's.
- The national mean total was 829 across 1,177,767 test takers in 2024-25, so the average result sits just above the combined grade 8 line and below the grade 9 line.
- Nothing is sent to colleges and nothing counts for National Merit. The PSAT/NMSQT in junior year is the only qualifying test.
- Staying level is losing ground, because the benchmark climbs roughly 20 points per section every year through to the SAT.
What is a good PSAT 8/9 score?
A good score is one that meets or exceeds the grade-level benchmark for the grade your child is actually in. College Board publishes those thresholds section by section, and they rise every year across the whole SAT Suite.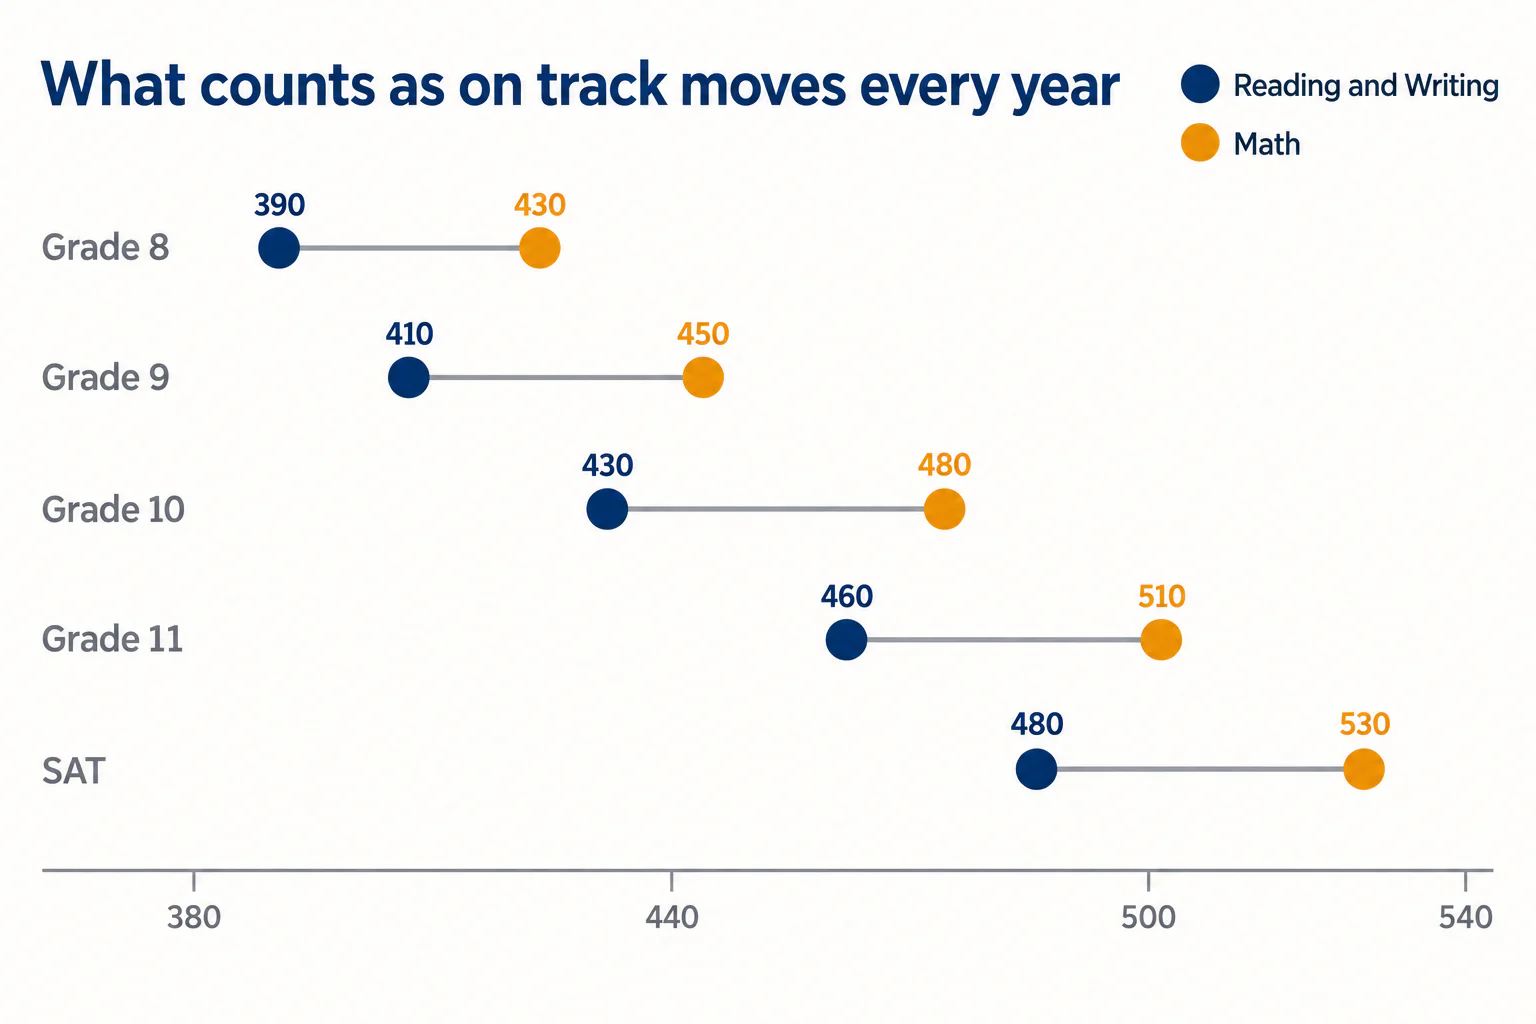
| Stage | Reading and Writing | Math | Section scale |
|---|---|---|---|
| Grade 8 (PSAT 8/9) | 390 | 430 | 120–720 |
| Grade 9 (PSAT 8/9) | 410 | 450 | 120–720 |
| Grade 10 (PSAT 10, PSAT/NMSQT) | 430 | 480 | 160–760 |
| Grade 11 (PSAT 10, PSAT/NMSQT) | 460 | 510 | 160–760 |
| SAT college and career readiness | 480 | 530 | 200–800 |
The bands either side of the benchmark are published too, and they are narrow. In grade 8, Reading and Writing of 370 to 380 is Approaching and 390 or above is Meets or Exceeds; in Math, 410 to 420 is Approaching and 430 or above meets. In grade 9 every one of those boundaries moves up by 20 points.
What the SAT benchmark means is worth knowing, because the whole ladder is calibrated to it. College Board states that a student meeting the SAT Reading and Writing benchmark has a 75% chance of earning at least a C in a first-semester credit-bearing college course in history, literature, social sciences or writing. The grade 8 and grade 9 numbers are simply the waypoints on the way to that.
The test behind the number
The PSAT 8/9 takes 2 hours and 14 minutes and has two sections. Reading and Writing is 54 questions in two 32-minute modules. Math is 44 questions in two 35-minute modules, with a calculator permitted on the entire section.
Both sections are multistage adaptive. The first module carries a mix of easy, medium and hard questions, and how your child performs on it decides whether the second module is harder or easier. Inside each module, questions run from easiest to hardest, which is a pacing cue worth telling a 13-year-old about in advance.
Two practical details follow from the design. Guessing is free: College Board's own guidance is that "for most students, it's better to guess than leave a question blank, especially if you can eliminate one or two wrong answers first." And roughly 30% of Math questions are set in a real-world, science or social studies context, so reading speed shows up in the Math score as well. If the adaptive structure is new to you, our explainer on how the digital SAT adaptive modules work covers the same mechanism on the senior test.
Why the same score changes verdict between grade 8 and grade 9
Because the benchmark moves and the scale does not. The PSAT 8/9 is the same test with the same 120 to 720 sections whether your child sits it in eighth or ninth grade, but the threshold printed beside the score is 20 points higher for the older cohort.
Work the overlap and the consequence is stark. In Math, the range 430 to 440 is "Meets or Exceeds" for an eighth grader and "Approaching" for a ninth grader. In Reading and Writing, 390 to 400 does the same thing. A child who sits the test in grade 8, scores 435 in Math, sits it again in grade 9 and scores 435 again has not held steady. They have moved from on track to off track without a single digit changing.
This is the part that makes the report useful rather than alarming. Growth is the measurement, not position. College Board designs the suite that way on purpose: all four tests share one score scale, so "a student who took the PSAT 8/9 and received a Math section score of 500 would be expected to also get a 500 on the SAT, PSAT/NMSQT, or PSAT 10 if they had taken any of those tests on that same day." A 500 is a 500 everywhere. The lower ceiling on the PSAT 8/9, 1440 rather than 1600, exists because the scale stops earlier for younger testers, not because the test is marked generously.
So the arithmetic a parent should actually run is the gap to the SAT line. Reading and Writing climbs from 390 in grade 8 to 480 on the SAT, which is 90 points across four years. Math climbs from 430 to 530, which is 100 points. Those are our calculations from the published benchmarks, and they come out at roughly 20 to 25 points per section per year. That is the pace of ordinary school progress, which is the reassuring reading, and it is also why a flat result two years running deserves attention.
Not sure where your teen stands? A free consultation with Catalyst Test Prep maps exactly which SAT topics need the most work, so you're never guessing about study time.
Book a Free Consultation →What the national average does and does not tell you
The average is lower than most parents expect. Across the 2024-25 school year, 1,177,767 students took the PSAT 8/9, and the mean total was 829, built from a Reading and Writing mean of 405 and a Math mean of 423.
Set that against the benchmarks and the picture is honest rather than flattering. Add the grade 8 section thresholds together and you get 820; add the grade 9 ones and you get 860. The national mean of 829 therefore sits above the combined grade 8 line and below the combined grade 9 line. Those sums are ours, and they are illustrative only, because College Board sets the benchmarks per section and never on the total.
There is a split inside that average worth seeing. The autumn administration drew 426,603 testers and averaged 851. The spring administration drew 786,867 and averaged 816. The larger group scored 35 points lower on the total.
Resist the obvious inference. These are two different populations of students, not the same students getting worse, and College Board's report does not explain the gap. Schools choose their own administration window and the grade mix differs between them. The practical point is narrower and more useful: the "average score of all testers" printed on your child's report pools both windows across three years, so it is a loose reference point rather than a peer group.
Why is the total percentile higher than both section percentiles?
Because a percentile is a position in a distribution, and the total has its own distribution. It is not an average of the two section percentiles, and it can legitimately sit above both of them.
College Board's own sample report makes the point better than any explanation. A ninth grader scores 620 in Reading and Writing and 500 in Math, for a total of 1120. Her Reading and Writing score beats 60% of ninth-grade testers and her Math score beats 70%. Her total beats 75%. Neither section reaches the 75th percentile, and the total does.
Two further things about those percentiles matter when you read the number. They are grade-specific, so an eighth grader is compared with eighth graders and a ninth grader with ninth graders, drawn from the past three cohorts of testers worldwide. And a student testing outside those grades gets the nearest grade's table, so a seventh grader sitting the test early is measured against eighth graders.
One more figure on the report deserves more respect than it gets: the Score Range. It is derived from the standard error of measurement and shows how much the score would move if your child sat a different form of the test under identical conditions. A 20-point difference between two sittings is inside the noise, not progress.
Does the PSAT 8/9 count for National Merit?
No, and nothing about it reaches a college either. College Board is explicit that "the Preliminary SAT/National Merit Scholarship Qualifying Test (PSAT/NMSQT) is the qualifying test for the National Merit Scholarship Program," and entry runs through the junior-year sitting only.
The internal evidence on the report itself confirms it. A PSAT/NMSQT score report carries an NMSC Selection Index on a 48 to 228 scale. The PSAT 8/9 report carries exactly three scores, two section scores and a total, and no Selection Index anywhere. If you are looking ahead to the test that does count, our guides to the PSAT 10 against the PSAT/NMSQT and what counts as a good PSAT score in grade 10 and 11 pick the story up from there.
This is the strongest argument for taking the PSAT 8/9 seriously as information and not at all seriously as a result. It is the one test in the suite where a disappointing number costs your child nothing, which makes it the only completely clean diagnostic you will get.
What to do in the fortnight after the score lands

Four jobs, and none of them is a prep course.
- Compare each section against your child's own grade. Write the two benchmark numbers down before you look at the scores, so you are not reading the grade 10 column by accident.
- Open the eight content domain bars. The report shows four domains in Reading and Writing and four in Math, with the approximate question count and share of the section for each, so a weak bar on a domain carrying 26% of the section is worth more than a weak bar on a small one.
- Check the access route. US students aged 13 and over who gave a mobile number during test setup can see scores in the BigFuture School app. Under 13, the full report comes through the school counsellor, which catches many eighth-grade families out.
- Diarise the next measurement. A ninth grader can sit the PSAT/NMSQT or PSAT 10 in the spring to measure growth on the same scale. Our SAT prep timeline sets out when the serious work genuinely starts, and it is later than most families think.
One caution from College Board, worth repeating because it is easy to ignore in a disappointing week: benchmarks "shouldn't be used to assign academic tracks, to discourage students from pursuing college, or to keep students from participating in challenging courses." A score below the line leaves three or four years of runway depending on the grade, not a ceiling. And one date for the diary: College Board has said that "in 2027, College Board plans to use a rigorous empirical process to evaluate the continued appropriateness of the benchmark scores," so the numbers in the table above are current rather than permanent.
If you want to see what a section score turns into further up the suite, our digital SAT score calculator works on the same common scale.
Where this leaves you
A good PSAT 8/9 score is a score that clears your child's own grade line: 390 and 430 in grade 8, 410 and 450 in grade 9, judged section by section rather than on the total. The national mean of 829 tells you the average result is roughly on track for an eighth grader and behind for a ninth grader, which is a useful piece of perspective on a number that can feel small next to 1600.
The report's real value is that it is free of consequence. Nothing goes to a college, nothing counts for National Merit, and nobody will ever ask about it. That makes it the cleanest read you will ever get on which of the eight content domains your child is actually behind on, and with three or four years left, that information is worth considerably more than the score beside it.
Ready to turn a prep plan into real score gains? Catalyst's 1:1 live online SAT programme starts with a free consultation to benchmark your teen's starting point and build a personalised path to their goal score.
Book a Free ConsultationSources checked 3 November 2026: College Board, SAT Suite benchmarks; PSAT 8/9 Understanding Scores, Fall 2026; College Board 2025 SAT Suite Annual Report, Total Group.