
Your SAT score report shows eight skill bars, and students almost always attack the shortest one first. That instinct is wrong often enough to matter, because the eight areas are not worth the same. Two of the four Math areas are roughly 35 per cent of the section each, and the other two are roughly 15 per cent each. Knowing how to read your SAT score report mostly means knowing which bar is worth your December.
Scores from the 7 November 2026 SAT release on 20 November, and the 5 December test releases on 18 December. When the report opens it carries a total, two section scores, a range around each one, percentiles and that eight-bar graphic, and each of those answers a different question.
This guide goes through the report in the order it appears, says what each number can and cannot tell you, and ends with the only ranking that should drive what you do next. For the ACT equivalent, we covered how to read your ACT score report separately, because the two documents work differently.
Key takeaways
- Total score 400 to 1600, two section scores 200 to 800 each, plus a score range around each.
- The Knowledge and Skills graphic has eight bars, four per section, and they cover very different shares of the test.
- Algebra and Advanced Math are about 35% of Math each. Geometry and Trigonometry is about 15%. Rank by points, not by bar length.
- College Board prints a score range because a single sitting is a measurement. Small gaps between test dates often sit inside it.
- 8 of the 98 questions you answered did not count. Four pretest items sit in each section.
What is on an SAT score report?
Six things, in roughly this order. Each one answers something different, and conflating them is where most misreadings start.
| What you see | What it is | What it cannot tell you |
|---|---|---|
| Total score | 400 to 1600, the two sections added | Which section is holding you back |
| Section scores | 200 to 800 for Reading and Writing, and for Math | Which content areas inside the section cost you |
| Score range | How much the score would likely move on another sitting | Whether a retake will go up |
| Percentiles | Your position against other students | How much you actually know |
| Knowledge and Skills | Eight bars, one per content area | How many points each area is worth |
| Score sends | Which colleges already have the score | Anything about your performance |
The eight bars, and why they are not equal
College Board's report shows "a graphic that represents your performance on each of the eight content areas measured on the test. There are four content areas in Reading and Writing and four in Math." For each one you get the approximate number of questions, the percentage of the section it covers, and a visual indication of how you did.
That percentage is the part students skip, and it is the part that decides where the points are.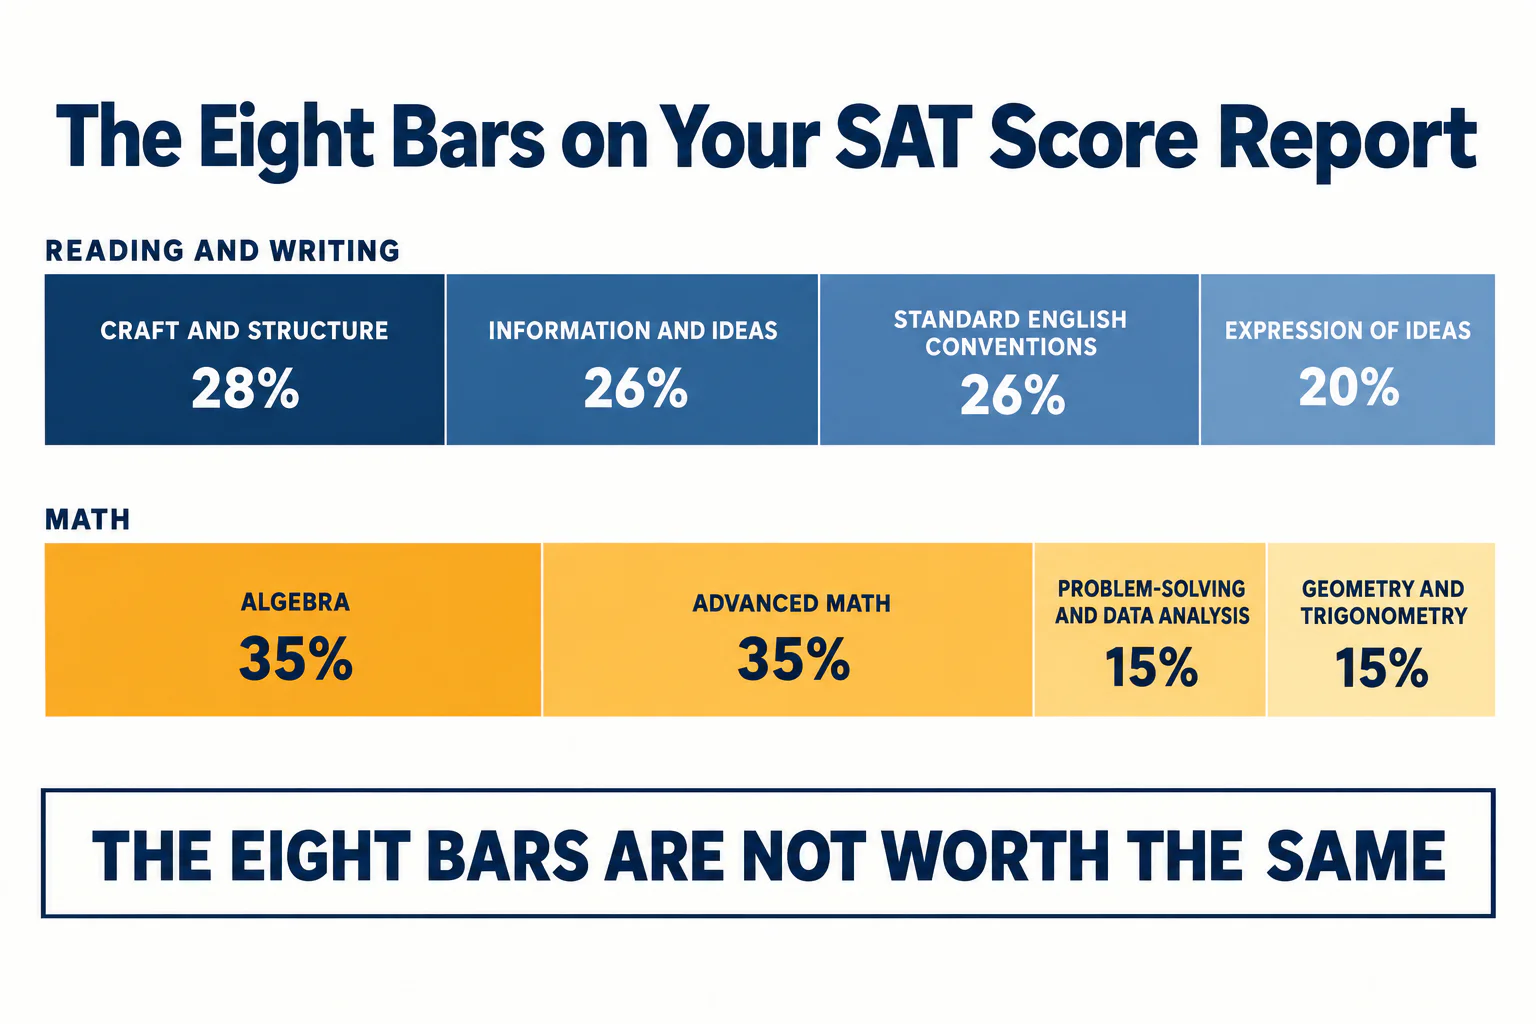
Reading and Writing: four areas, fairly evenly split
Craft and Structure is about 28 per cent, Information and Ideas about 26 per cent, Standard English Conventions about 26 per cent, and Expression of Ideas about 20 per cent. The spread between the largest and the smallest is only eight percentage points, so on this section the instinct to work on your weakest bar is roughly sound.
Math: four areas, and two of them dominate
Algebra is about 35 per cent and Advanced Math about 35 per cent. Problem-Solving and Data Analysis is about 15 per cent, and Geometry and Trigonometry about 15 per cent. So the two biggest areas are each more than twice the size of the two smallest, and together they are about 70 per cent of the Math section.
That changes the advice completely. A student whose weakest bar is Geometry and Trigonometry is looking at roughly six questions. A student with a middling Algebra bar is looking at roughly fourteen. Fixing the middling area is worth more than fixing the weak one.
Which bar should you actually work on?
Rank the areas by points available, then look at your bars. Not the other way round.
The honest rule is a product, not a ranking: how weak the bar is, multiplied by how many questions sit behind it. A near-empty bar on 15 per cent of the section and a half-full bar on 35 per cent are not the same opportunity, and the second one is usually the better buy.
Two caveats worth stating. If an area is genuinely at zero, fix it regardless of weight, because a total blank is cheap to improve and tends to cost more than the percentage suggests. And if you are already near the top of the scale, the small areas matter more, because at that level you are no longer losing points in bulk anywhere. Our guide to breaking the 1400 to 1500 barrier covers how the arithmetic changes up there.
Not sure where your teen stands? A free consultation with Catalyst Test Prep maps exactly which SAT topics need the most work, so you're never guessing about study time.
Book a Free Consultation →Why is your score printed as a range?
Because a test score is a measurement and measurements have error. College Board states that your report includes "a Score Range, which shows how much your scores would likely vary if you took a different administration of the test under identical conditions".
Read that carefully: identical conditions, same student, different day, different number. The range is not a hedge or a disclaimer. It is the test maker telling you how precise the instrument is.
What counts as a real change
The practical consequence is about retakes. A student who moves from 640 to 660 has not necessarily improved, and a student who drops ten points has not necessarily got worse. Your own range is printed on your own report, so look at the actual width rather than guessing it, and treat movements inside it as noise. Movements well outside it are real. If you are weighing another sitting, retaking the SAT strategically covers when it pays.
Eight of your questions never counted
The Reading and Writing section presents 54 questions, of which 50 are operational, with 25 operational plus 2 pretest in each of its two modules. Math presents 44 questions, of which 40 count, with 20 operational plus 2 pretest per module. The pretest items are being trialled for future tests and contribute nothing to your score.
Two things follow. You cannot identify them, so answer everything and never spend extra time hunting for the "fake" questions. And the eight bars are drawn from fewer questions than the question counts suggest, which is another reason to treat a short bar in a small area as a weak signal rather than a verdict.
What the percentiles do and do not mean
A percentile is your position in a group, not a measure of knowledge. It moves when the group moves. A student can perform identically on two administrations and read two different percentiles, because the comparison cohort changed.
It is still the most useful single number for answering "is this competitive", which is why we wrote what counts as a good SAT score around it. Just do not treat a percentile as a skill level, and do not average it with anything.
What colleges see, and what is only for you
Colleges receive your scores. The Knowledge and Skills display is a study tool you look at, not an admissions document, so a short bar is not something an admissions officer is weighing against you. That matters because students regularly worry about a weak area being visible, and then study to hide it rather than to gain points.
Score sending is a separate decision with its own deadlines and its own trap around the four free reports, which we set out in how to send SAT scores.
Reading the report in ten minutes
Do this in order, once, within a week of the scores landing while you still remember the test.
- Compare the two section scores. The lower one is where the next block of time goes, unless they are within about twenty points of each other.
- Write down your score range width from the report itself, and use it as your definition of a meaningful change.
- List the four areas in the weaker section in order of weight, not in order of bar length. For Math that order is Algebra, Advanced Math, then the other two.
- Find the first area on that list where your bar is not full. That is your target.
- Connect it to questions you actually remember. If you cannot recall struggling there, treat the bar with more caution, because it may rest on very few questions.
- Ignore everything else for a month. Two areas worked properly beats eight areas glanced at.
The short version
The total tells you where you stand, the section scores tell you which half to work on, and the eight bars tell you where inside it. The bars are the useful part and the most misread, because they show performance without showing stakes: Algebra and Advanced Math are about 35 per cent of Math each while the other two areas are about 15 per cent each, so the shortest bar is frequently the wrong target.
Read the score range as the test maker's own statement of precision, treat small movements as noise, and build your next month around the heaviest area where you are not already full.
Ready to turn a prep plan into real score gains? Catalyst's 1:1 live online SAT programme starts with a free consultation to benchmark your teen's starting point and build a personalised path to their goal score.
Book a Free ConsultationScore report contents, content-area weights and the operational versus pretest question counts verified against College Board's score explanation page and its published test specifications on 22 October 2026. Percentages are College Board's own approximations and vary slightly between forms.