
Two of the eighteen Big Ten schools will never read your SAT score. UCLA does not consider it, by system-wide policy. Washington collects it and then hides it from the people reading your file. Meanwhile Ohio State has just put its requirement back, and Purdue says it expects a score from everyone who applies.
So the most common question asked about this conference, what are the average SAT and ACT scores for Big Ten schools, has a misleading answer waiting for it. Aggregator sites will tell you roughly 1,375, with an ACT around 30. That figure averages eighteen very different admissions regimes, and it cannot tell you what to do next.
Below are the real middle-50% ranges for every school that reports them, taken from the U.S. Department of Education's own dataset, alongside what each school actually does with a score once it arrives.
Key Takeaways
- The spread is about 400 points. Northwestern's admitted middle 50% tops out near 1,570; Nebraska's starts near 1,100. A conference-wide average describes no real applicant.
- UCLA will not look at your score at all, and Washington's reviewers do not see it. Sending one to either changes nothing about how your file is read.
- Ohio State requires scores again for Columbus first-year applicants from the 2026 cycle, and Purdue reports that 98.3% of its 2026 admits submitted one.
- The federal data runs one cycle behind. These figures describe students who enrolled in autumn 2024, so read them as a floor rather than as this year's bar.
- Submit at or above a school's midpoint, hold back below its 25th percentile. That single rule settles most test-optional decisions.
Average SAT and ACT Scores at Every Big Ten School
The table gives the 25th to 75th percentile range for enrolled students at each Big Ten school, sorted by SAT strength. Half of admitted students scored inside each range, a quarter below it, a quarter above.
Every figure comes from the 2024 reporting year of the College Scorecard, the U.S. Department of Education dataset that institutions file themselves. Using one source for all eighteen is deliberate: it makes the schools genuinely comparable, which a patchwork of individual press releases does not.
| School | SAT Reading & Writing | SAT Math | SAT combined (approx.) | ACT composite | Admit rate |
|---|---|---|---|---|---|
| Northwestern | 740–770 | 770–800 | 1510–1570 | 33–35 | 7.7% |
| USC | 710–760 | 740–790 | 1450–1550 | 32–35 | 9.8% |
| Maryland | 690–750 | 710–780 | 1400–1530 | 32–35 | 44.8% |
| Wisconsin | 670–740 | 710–780 | 1380–1520 | 29–33 | 45.2% |
| Michigan | 680–750 | 680–780 | 1360–1530 | 31–34 | 15.6% |
| Illinois | 650–740 | 660–780 | 1310–1520 | 30–34 | 42.4% |
| Rutgers | 650–730 | 660–770 | 1310–1500 | 28–33 | 58.1% |
| Ohio State | 640–720 | 670–760 | 1310–1480 | 28–32 | 60.6% |
| Minnesota | 640–730 | 660–770 | 1300–1500 | 26–31 | 79.8% |
| Penn State | 620–700 | 620–720 | 1240–1420 | 27–32 | 60.6% |
| Purdue | 600–720 | 600–760 | 1200–1480 | 27–34 | 49.9% |
| Michigan State | 590–680 | 590–680 | 1180–1360 | 25–31 | 84.8% |
| Indiana | 590–690 | 580–710 | 1170–1400 | 27–33 | 78.2% |
| Iowa | 570–670 | 560–660 | 1130–1330 | 21–28 | 83.6% |
| Oregon | 580–690 | 550–670 | 1130–1360 | 23–30 | 88.3% |
| Nebraska | 560–670 | 538–660 | 1100–1330 | 22–28 | 87.5% |
| UCLA | not considered | not considered | not considered | not considered | 9.0% |
| Washington | not reported | not reported | not reported | not reported | 39.1% |
Read the admit-rate column against the scores, because the two do not move together. Michigan State admits 84.8% of applicants and Minnesota 79.8%, yet both report ranges sitting above Iowa and Oregon. A high admit rate does not mean a low bar among the students who actually enrol.
Two Big Ten Schools Will Not Look at Your Score
This is the detail that makes a conference average meaningless, and almost no score round-up mentions it.
UCLA is test-free. The University of California does not consider SAT or ACT scores when making admissions decisions or awarding scholarships, at any campus. A score you send can only satisfy a minimum eligibility route or place you in a course once you have enrolled. Applicants for autumn 2027, who apply by 30 November 2026, will not be required to submit anything. UC's academic senate has been asked to review the role of testing and is expected to recommend a policy no later than June 2027, so nothing shifts before then.
Washington goes one step beyond test-optional. The university removed the requirement permanently and states that reviewers will not see your test scores even if you provide them. Two exceptions are worth knowing. A high score, which Washington describes as 1400 SAT or 31 ACT and above, may be considered for a small number of applicants who would not otherwise be admitted. And homeschooled applicants, or those from schools without letter or numeric grades, are still required to submit.
If UCLA or Washington is the first choice, testing time is better spent on coursework and essays. That is not advice you expect from a page written by a test-prep company, and it is still the right answer.
Which Big Ten Schools Require the SAT or ACT?
Two, in practice. Ohio State requires a score and Purdue expects one. The rest of the conference is optional for the current cycle, except the two schools above where the score is never read.
Ohio State has reinstated the requirement. First-year applicants to the Columbus campus must submit an SAT or ACT score, beginning with the 2026 admissions cycle and applying to the autumn, spring and summer 2027 terms. Ohio State's regional campuses stay test-optional, so check the campus you are applying to rather than the university name.
Purdue expects a score without formally requiring one. Its admission criteria say applicants are expected to have SAT, ACT or CLT results, with exceptions possible in unusual cases, and that 98.3% of students admitted in 2026 provided one. Purdue also lets you report your highest section scores across different test dates, and results must be from within the past five years. A policy that is optional on paper and 98.3% in practice is a requirement, and deserves to be planned for as one.
Not sure where your teen stands? A free consultation with Catalyst Test Prep maps exactly which SAT topics need the most work, so you're never guessing about study time.
Book a Free Consultation →What the Single Big Ten Average Gets Wrong
Four things, and each one changes a decision.
It averages across incompatible policies. A conference figure near 1,375 is computed from the schools that report scores, then quoted as though it describes the Big Ten. It silently drops UCLA and Washington, so the number answers a question about sixteen schools while appearing to answer one about eighteen.
Combined ranges are added, not measured. The SAT combined column above, like every such column anywhere, is the Reading and Writing range plus the Math range. That is an approximation, because the student at the 25th percentile in Math is usually not the student at the 25th percentile in Reading. True combined percentiles sit slightly inside the added range. Use the section figures when you want precision and the combined one only to orient yourself.
The data is a year behind. The 2024 reporting year describes students who enrolled in autumn 2024. Ranges at selective schools have generally drifted upward as more applicants submit again, so treat these as a floor. Purdue publishes a fall 2025 middle 50% of 1220 to 1480 on its own site, slightly above the 1200 to 1480 in the federal file.
Some reported numbers are derived rather than observed. Nebraska's Math 25th percentile appears as 538. SAT section scores only come in ten-point steps, so no student has ever scored 538. It is a sign that some institutional submissions are calculated from an underlying distribution rather than read off a list. Close enough to use, precise enough to mistrust at the margin, which is a fair summary of this dataset in general.
Is Your Score Strong Enough to Send?
Compare it to the school's own range, never the conference average. The midpoint of a school's middle 50% is roughly where its median admitted student sits, and that is your reference point.
- At or above the 75th percentile: submit everywhere that reads scores. Your score is doing active work on the application.
- Between the midpoint and the 75th: submit. You are above the median admitted student and the score supports you.
- Between the 25th and the midpoint: a judgement call. Submit if the rest of your file is average for the school, since the score then adds information. Hold back if your grades and coursework are genuinely strong, because they carry more weight alone.
- Below the 25th percentile: do not submit to test-optional schools. You would be handing the reader a reason to doubt an application they would otherwise judge on its merits.
- Any score, at a school that requires one: submit, and build the retake calendar early enough to get two attempts in before the deadline.
One consequence of the table is worth sitting with. A 1,300 is a strong submit at eight Big Ten schools and a weak one at five. Same number, opposite advice, decided entirely by the list. To do that arithmetic for a specific score, our SAT score calculator turns a practice result into a projected scaled score, and our guide to what counts as a good SAT score covers the national percentiles sitting behind these ranges.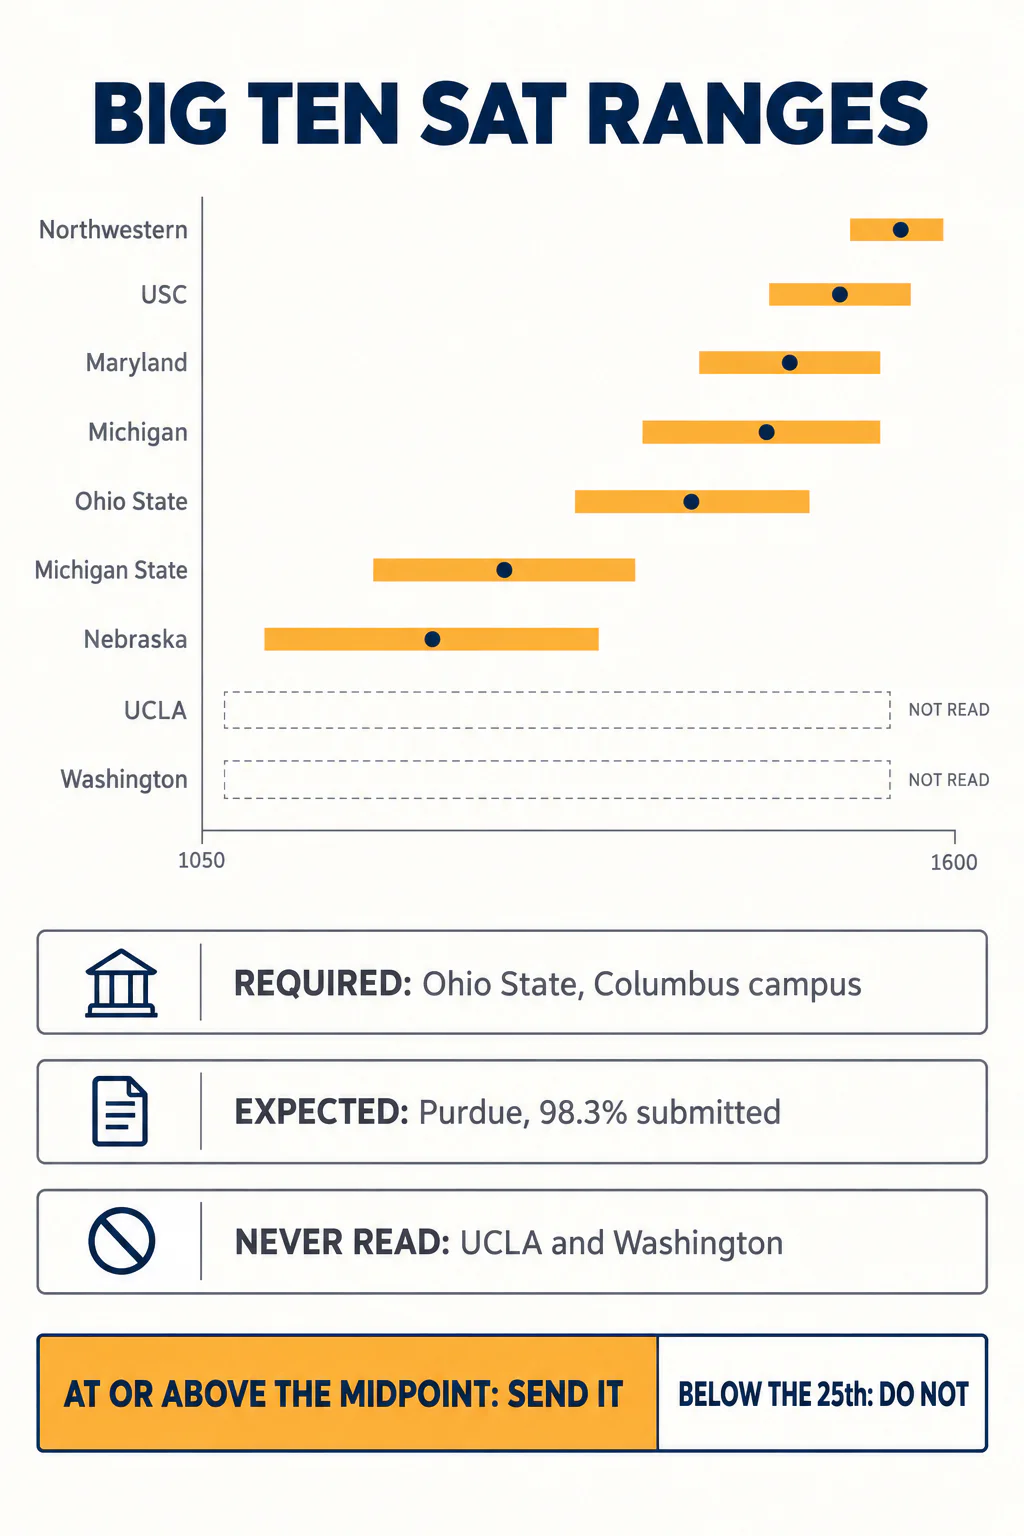
Sending the SAT or the ACT: Which Helps More
Neither test is preferred at any Big Ten school. Purdue states outright that it has no preference and does not require a separate ACT Science score. Where both ranges are published, send whichever places you higher relative to that school's range, not whichever carries the bigger-looking number.
This is easy to get wrong because the two scales are unrelated. A 30 ACT and a 1,360 SAT are close to equivalent nationally, yet at Iowa a 30 sits above the 75th percentile while at Michigan it falls below the 25th. Work it out school by school. Our SAT to ACT score conversion table handles the arithmetic, and if the real question is whether to keep pushing a current score upward, how long score improvement actually takes gives the realistic timeline.
Two further policies to check per school rather than assume. Whether superscoring is accepted, which our guide to superscoring and Score Choice explains. And whether scores feed merit aid, which they frequently do even where admission is test-optional. Several Big Ten institutions use test scores for merit scholarship consideration after the admission decision is made, so a score that cannot get you in may still be worth money.
Where to Go From Here
The useful version of this question is never what the Big Ten average is. It is what each school on your list does with a score, and what number makes you competitive there. Those answers differ by 400 points and by three separate policies inside one conference.
Sort your list into the three groups first: schools that require a score, schools where submitting is your choice, and the two where it will not be read. Then set one target number, taken from the strongest school that will actually look at it.
Ready to turn a prep plan into real score gains? Catalyst's 1:1 live online SAT programme starts with a free consultation to benchmark your teen's starting point and build a personalised path to their goal score.
Book a Free Consultation