

AP Seminar has the second highest pass rate of any AP exam, and it ranks 38th out of 40 on the share of students earning a 5. Both facts come from the same College Board table. That single pair of numbers is enough to break the way almost every online ranking uses the AP score distributions, because a list that calls Seminar easy and a list that calls it hard can both cite the official data and neither is lying.
The 2026 distributions are published and complete. They are genuinely useful. They just do not measure what the "easiest AP exams" lists claim they measure, and the gap between those two things is where students choosing exams before the November ordering deadline get hurt.
Key takeaways
- Across the 40 exams in the 2026 table, the median share scoring 3 or higher is 72% and the median share scoring 5 is 18.5%.
- The two measures barely agree with each other. The correlation between an exam's 5 rate and its 3 or higher rate is just 0.21, so ranking by one tells you almost nothing about the other.
- An AP score is defined against a college course grade, not against the other candidates, so a distribution describes the group that enrolled rather than the difficulty of the paper.
- AP Calculus BC builds on AP Calculus AB and still returns 46% fives against AB's 20%. Strictly more content, more than double the top score rate.
- The final ordering deadline for 2027 exams is 13 November 2026, and a late order costs 40 dollars per exam.
What do the AP score distributions actually show?
They show the percentage of candidates who earned each score from 1 to 5 on each exam in a single year, and nothing else. College Board publishes them on its student site, released on a rolling basis from late June. The 2026 set covers 40 exams.
Read as a group, the spread is wider than most summaries admit. On the share of candidates scoring 3 or higher, the range runs from 59% on AP Music Theory to 90% on AP Research. On the share earning a 5, it runs from 7% on AP 3-D Art and Design to 48% on AP Chinese Language and Culture. Those are not small differences, and they are the reason the tables get mined for difficulty rankings in the first place.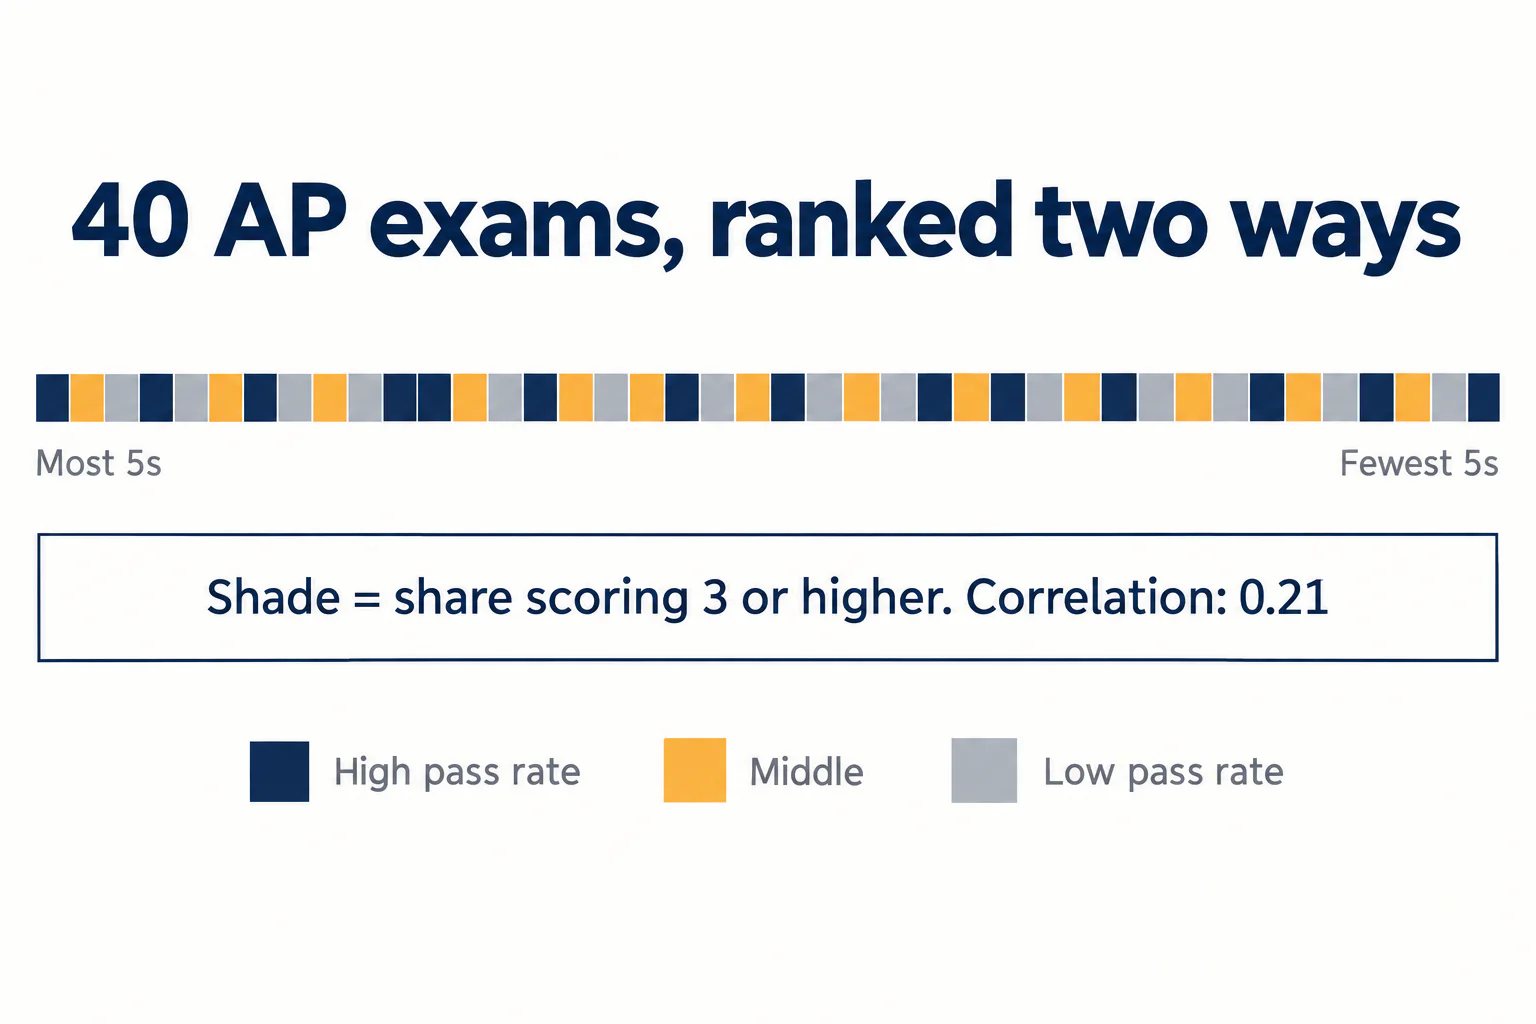
Why a pass rate is not a difficulty rating
An AP score is a statement about college readiness, not a rank against the other people in the room. College Board's own score scale is explicit: a 5 means "extremely well qualified" and maps to a college course grade of A+ or A, a 4 is "very well qualified" at A-, B+ or B, and a 3 is "qualified" at B-, C+ or C. A 2 is "possibly qualified" and a 1 carries "no recommendation".
Nothing in that scale is set relative to the candidate pool. The standard is fixed to an external reference, which means the distribution moves when the population moves. An exam taken overwhelmingly by well prepared seniors in a strong programme will return a high share of 5s whether or not the paper is demanding. An exam that schools open to everybody will return a lower one.
So the honest reading of a high pass rate is "the people who sat this exam were ready for it", which is a fact about them and not an offer to you.
Does the 5 rate agree with the 3 or higher rate?
Almost not at all, and this is the finding that should stop anybody using a single difficulty ranking. We ranked all 40 exams in the 2026 table twice, once by the share scoring 5 and once by the share scoring 3 or higher, and compared the two orders. The correlation is 0.21. Four exams show how far apart they can fall.
| Exam | Scoring 5 | Rank on 5s | Scoring 3+ | Rank on 3+ |
|---|---|---|---|---|
| AP Seminar | 10% | 38th | 88% | 2nd |
| AP Computer Science A | 25% | 5th | 66% | 36th |
| AP Calculus AB | 20% | 11th | 65% | 37th |
| AP 3-D Art and Design | 7% | 40th | 75% | 11th |
| AP Music Theory | 18% | 21st | 59% | 40th |
AP Computer Science A is the fifth most likely exam to yield a 5 and the fifth least likely to yield a pass. AP Seminar is the near opposite. AP Music Theory is the clearest case of all: it sits mid table on 5s and dead last on 3 or higher, and 19 of the other 39 exams have a lower share of 5s but a higher share of passes.
These are not rounding artefacts. They describe real and different things: the 5 rate tells you about the top of a cohort, the pass rate tells you about its floor, and an exam can have a strong top and a weak floor at the same time.
Not sure where your teen stands? A free consultation with Catalyst Test Prep maps exactly which AP topics need the most work, so you are never guessing about study time.
Book a Free Consultation →Calculus AB and BC settle the argument
The cleanest proof that a distribution measures the cohort sits inside one subject, where the content relationship is not in dispute. College Board describes the BC course plainly: "In AP Calculus BC, you'll cover many of the mathematical principles in AP Calculus AB and build upon them."
BC is the larger course. It contains AB's material and adds to it. Here is how the two performed in 2026.
| Exam | Content | Scoring 5 | Scoring 3+ |
|---|---|---|---|
| AP Calculus AB | Base course | 20% | 65% |
| AP Calculus BC | AB material plus more | 46% | 82% |

The 5 rate on the harder course is 2.3 times the rate on the easier one. No account of exam difficulty survives that. What explains it is selection: students reach BC by clearing AB-level work first, usually in a school with a calculus pathway and a teacher who can staff it. If you are choosing between them, our direct comparison of AP Calculus AB and BC works from the syllabus rather than the pass rate.
Which exams look easiest, and why that is the wrong question
Sort the 2026 table by 5 rate and the top is AP Chinese Language and Culture at 48%, AP Japanese Language and Culture at 47%, then Calculus BC at 46%. Every "easiest AP exam" list in circulation is built from roughly this ordering.
Ask the question that matters instead: would your score land in that distribution? For the two language exams at the top, a candidate arriving with years of prior exposure to the language is in a different position from one starting in a first-year class, and the published rate is the average of both. The rate is real. It is just not transferable, and treating it as a forecast of your own result is the single most expensive mistake available in October.
The same trap works in reverse. AP Statistics returns 62% at 3 or higher, the second lowest pass rate in the table, and it is routinely marketed as the gentle maths option. AP Computer Science Principles is the designed-for-beginners course and returns the joint lowest 5 rate at 10%. Neither reputation matches its data.
How should you actually choose which AP exams to take?
Order on what the exam is worth to you and what you can be taught, in that order. The distributions belong at the end of that process as a sanity check, not at the start as a shortlist.
- Check the credit first. A 5 on an exam your target college does not accept is worth less than a 3 on one it does. We set out how to read the policies in what an AP score is actually worth for college credit.
- Weigh the teaching you will get. The single biggest driver in the data is cohort preparation, and your cohort is your class. A well taught section of a demanding course beats a badly taught section of an easy one.
- Count your spring. AP season collides with SAT season, and the two reward different revision. Balancing SAT prep with school and AP exams covers the collision.
- Audit the practice material that exists. Some courses have far thinner official practice than others, which changes how preparable they are. See what released AP exams actually contain.
- Then look at the distribution, and read both columns rather than one.

What the distributions cannot tell you
Three limits are worth stating, because each one is routinely ignored.
They carry no information about individuals. A distribution is a summary of a group you are not yet part of. They carry no information about your school's section, where the variation between two classrooms teaching the same course can be larger than the variation between two different exams. And a single year is one year: curricula change, cohorts change, and the 2027 administration moves several courses between digital and hybrid formats, which our guide to AP prep books covers in detail.
Used properly, the tables answer one question well. Given a cohort broadly like the one that sat this exam, roughly what spread of outcomes followed? That is worth knowing. It is not a difficulty league table, and it never was.
The short version
The 2026 AP score distributions are a good dataset being asked the wrong question. Ranked by 5 rate and by pass rate, the same 40 exams produce two orders that correlate at 0.21, and exams such as Seminar, Computer Science A and Music Theory land in almost opposite places depending on which column you read. Because an AP score is pinned to a college course grade rather than to the candidate pool, every one of these rates describes the students who enrolled. Calculus BC proves the point from the inside: more content than AB, and 2.3 times the share of 5s.
Order the exams that carry credit at your colleges and that you will be taught well, get the order in before 13 November, and use the distributions to check your expectations rather than to pick your subjects.
Ready to turn a prep plan into real score gains? Catalyst's 1:1 live online programme starts with a free consultation to benchmark your teen's starting point and build a personalised path to their goal score.
Book a Free ConsultationSources: College Board, 2026 AP Score Distributions; College Board, AP Score Scale Table; College Board AP Calculus BC course description; AP Central 2026-27 key dates. All figures checked 27 October 2026. Rank and correlation analysis our own, computed from the published 2026 table.