
A 1350 SAT score puts you ahead of 89% of the students who actually sat the test, according to College Board's own user percentile table. That single number is where most articles stop. It is also where the useful part begins, because 89th percentile tells you nothing about whether to send the score to Penn State, and nothing at all about whether sending it to Wisconsin would help you.
This post does the part the percentile charts skip. It uses the federal government's admissions data to show where a 1350 lands at fourteen real universities, and it introduces the one column almost nobody checks before deciding whether to submit a test-optional score.
Key Takeaways
- A 1350 is the 89th percentile among SAT takers and the 94th on the nationally representative table. The second number is the one most blogs quote, and it is not the one colleges compare you against.
- The gap between those two tables never exceeds about 6 points anywhere on the current College Board chart, which makes the widely repeated claim of a 15 to 17 point spread simply wrong.
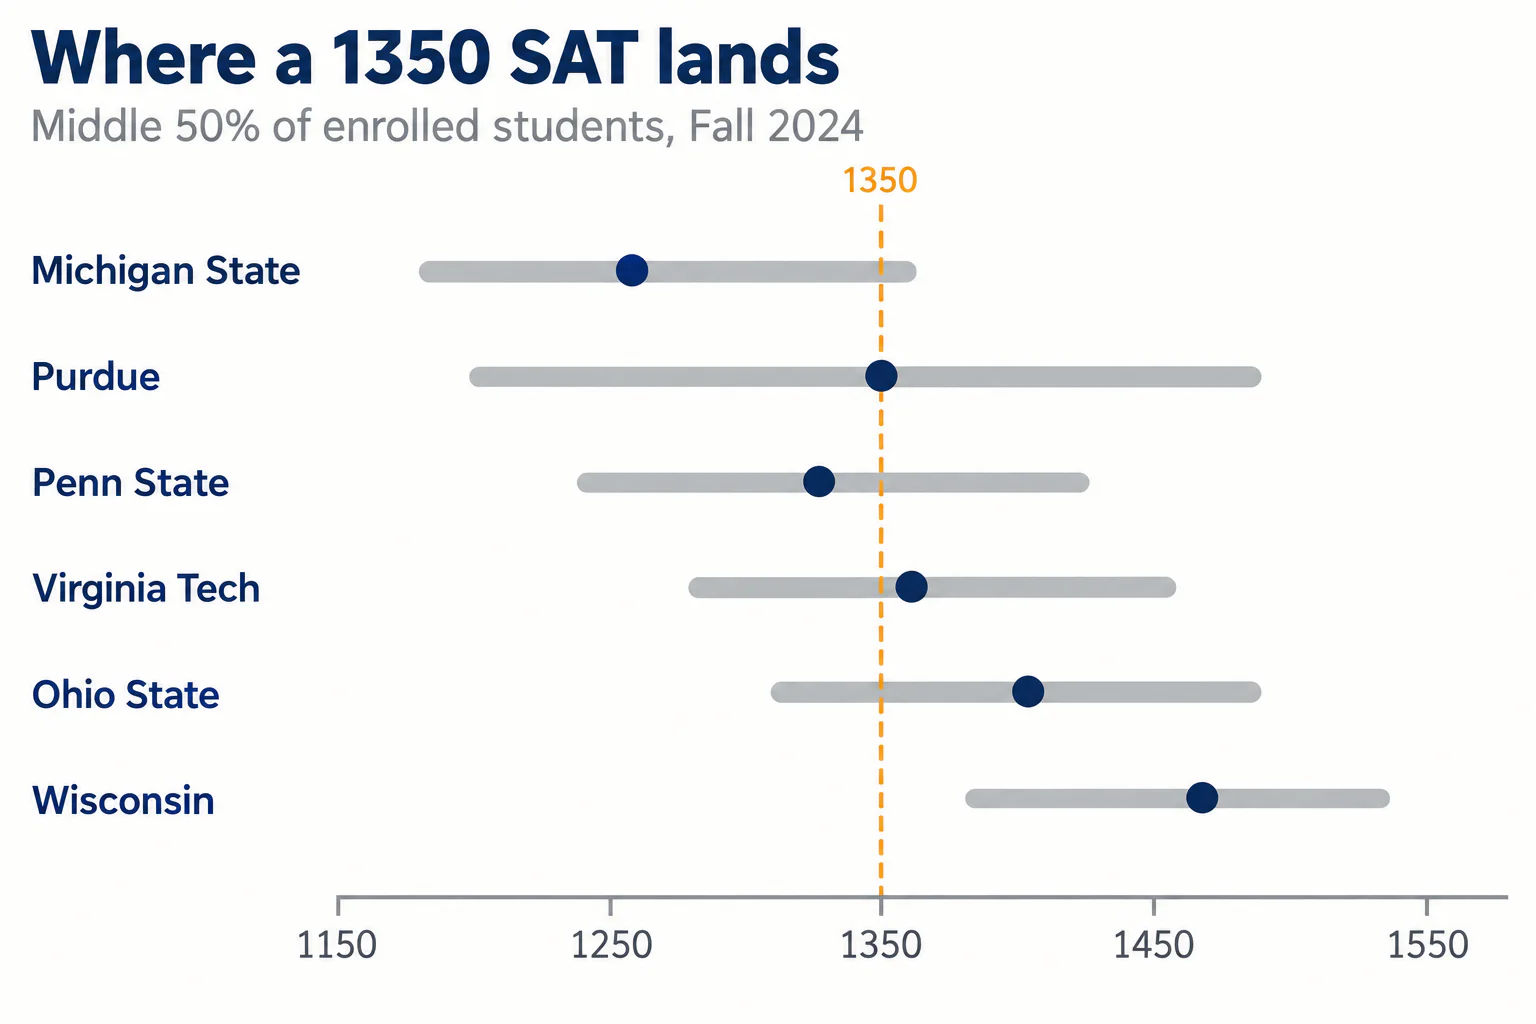
- A 1350 is above the median at Michigan State, Indiana Bloomington, Clemson, Penn State and Purdue, and inside the middle 50% at Virginia Tech, Pittsburgh, Georgia, UT Austin and Ohio State.
- Check the share of the class that submitted a score before trusting any published range. At Purdue it was 79%; at Wisconsin it was 15%. Those two ranges mean completely different things.
- Adding a school's two section percentiles gives an estimate of the composite, not the real composite percentile. Every list that presents the sum as fact is overstating its own precision.
What percentile is a 1350 SAT score?
A 1350 is the 89th percentile on College Board's user table and the 94th on its nationally representative table. Both numbers are published by College Board Research and both are correct. They answer different questions.
The nationally representative percentile comes from a research study weighted to represent every US student in grades 11 and 12, including the millions who never take the SAT at all. The user percentile covers the students who actually sat the test across the past three graduating classes. When an admissions office looks at your score next to the rest of its applicant pool, the second group is the pool.
The 15-point gap that does not exist
A claim circulating widely on prep sites says the two tables differ by 15 to 17 points, with 1200 given as 74th nationally representative against 57th user. Checked against College Board's current table this session, 1200 is the 81st nationally representative percentile and the 75th user percentile. The gap is 6 points, not 17.
That matters more than it sounds. If you believe your 1350 drops to the mid 70s among real test takers, you will aim at a weaker college list than your score justifies. The true answer is 89th, and 89th is a genuinely strong position.
Which colleges does a 1350 actually fit?
The table below comes from the National Center for Education Statistics College Navigator database, which publishes the SAT percentiles every US institution reports for its entering class. These are Fall 2024 figures, the most recent published, and they describe enrolled first-time students rather than applicants.
| University | SAT reading 25/50/75 | SAT maths 25/50/75 | Approx. composite median | % who submitted SAT |
|---|---|---|---|---|
| Michigan State | 590 / 630 / 680 | 590 / 630 / 680 | 1260 | 39% |
| Indiana Bloomington | 590 / 640 / 690 | 580 / 650 / 710 | 1290 | 42% |
| Clemson | 620 / 660 / 700 | 620 / 660 / 710 | 1320 | 35% |
| Penn State University Park | 620 / 660 / 700 | 620 / 670 / 720 | 1330 | 31% |
| Purdue West Lafayette | 600 / 660 / 720 | 600 / 690 / 760 | 1350 | 79% |
| Virginia Tech | 640 / 670 / 710 | 640 / 690 / 740 | 1360 | 41% |
| University of Pittsburgh | 640 / 680 / 720 | 640 / 680 / 740 | 1360 | 40% |
| University of Georgia | 640 / 680 / 730 | 630 / 690 / 750 | 1370 | 61% |
| UT Austin | 630 / 690 / 740 | 620 / 700 / 770 | 1390 | 56% |
| Ohio State Columbus | 640 / 680 / 720 | 670 / 720 / 760 | 1400 | 17% |
| Rutgers New Brunswick | 650 / 690 / 730 | 660 / 720 / 770 | 1410 | 50% |
| Illinois Urbana-Champaign | 650 / 700 / 740 | 660 / 740 / 780 | 1440 | 48% |
| Wisconsin Madison | 670 / 710 / 740 | 710 / 750 / 780 | 1460 | 15% |
| Boston University | 690 / 720 / 750 | 730 / 760 / 780 | 1480 | 33% |
Why the composite column says "approximate"
NCES publishes percentiles section by section, not for the composite. Adding the reading figure to the maths figure gives a close estimate, and it is what every college list on the internet does. It is not the real composite percentile, because the student sitting at the 25th percentile in reading is rarely the same student sitting at the 25th percentile in maths. Treat these numbers as a band, not a cutoff, and do not let a 20-point difference change your mind about a school.
Not sure where your teen stands? A free consultation with Catalyst Test Prep maps exactly which SAT topics need the most work, so you're never guessing about study time.
Book a Free Consultation →The column almost nobody checks
Look again at the last column. Purdue reported 9,110 students submitting an SAT, or 79% of its entering class. Wisconsin reported 1,241, or 15%. Ohio State reported 17%.
Those three ranges are not comparable, and treating them as though they are is the single most common mistake a test-optional applicant makes.
When 79% of a class submits, the published range is close to an honest description of the class. When 15% submits, the range describes the small group who looked at their score, decided it would help, and sent it. Everyone whose score would have dragged the average down simply did not submit. The result is a published band that floats well above the real academic profile of the students who enrolled.
So a 1350 at Wisconsin looks far below the 1460 median, but that median is a statistic about 15% of the class. A 1350 at Purdue sits exactly on a median built from 79% of the class, and that number can be trusted.
The rule: read the submission rate before you read the range. Above roughly 50%, treat the band as real. Below roughly 25%, treat it as a ceiling set by self-selection, and weight your grades and course rigour more heavily than the score.
Should you submit a 1350 to a test-optional college?
Submit when your 1350 is at or above the published median for submitters at that school. Withhold when it falls below the published 25th percentile. The band in between is where the submission rate decides it.
Applied to the table above, a 1350 goes in confidently at Michigan State, Indiana, Clemson, Penn State and Purdue. It is a judgement call at Virginia Tech, Pittsburgh and Georgia, where it sits between the 25th percentile and the median and the submission rates are around 40%. At Wisconsin and Boston University it falls below the 25th percentile and is better withheld.
One caution worth stating plainly. A withheld score does not disappear from the application; it is replaced by heavier weight on your transcript. If your grades are the weaker half of your profile, a 1350 may be worth submitting even slightly below a median, because it is the evidence you have.
What a 1350 is worth in scholarship money
Admission and money are different questions, and a 1350 answers them differently. Many public universities publish merit tables with explicit score bands, and those tables tend to step at round numbers. A score in the 1300s frequently clears an entry-level award; the larger bands commonly start at 1400.
That is the real argument for the next 50 points. Between 1350 and 1400 your admission odds at a flagship barely move, because you were already inside the band. The award tier can move by thousands of dollars a year. Check the specific university's published table rather than assuming, because these thresholds change annually and some have moved to holistic review.
How far is 1350 from 1400, really?
Fifty points is about four percentile points, from 89th to 93rd. In raw terms it is a handful of questions across two modules, and what a 1400 actually buys you is a smaller jump in admission terms than most students expect.
Students stuck at 1350 almost never have a content gap across the whole test. They have three or four question types that cost them points on every practice test, and the wrong instinct is to take another practice test to find out. The right move is to go back through the tests already taken and sort every wrong answer by why it was wrong: misread the question, knew the method and slipped, ran out of time, genuinely did not know. Four categories, and each one has a different fix. Only the last needs new teaching.
Our guide to reviewing an SAT practice test properly walks through that sort, and breaking the 1400 to 1500 barrier covers what changes once you are through this band. If you are coming up from lower down, going from 1200 to 1400 is the path into it.
What to do in the next four weeks
- Build the college list from the data, not from reputation. Look up each school on College Navigator, write down the two section bands and the submission rate, and sort by whether your 1350 is above the median, inside the band, or below the 25th.
- Sort your last two practice tests by error type. Four categories, counted. The largest category is your study plan.
- Check each college's superscore policy. If you have two sittings with different section strengths, superscoring and Score Choice may already have moved you past 1350 without another test.
- Decide the retake question on money, not pride. Pull the merit tables for your top three schools. If none of them step at 1400, another sitting is probably not worth the autumn.
- Run the numbers. Use the Digital SAT score calculator to convert raw practice results into the scaled score you would actually report.
Where this leaves you
A 1350 SAT score is strong. It beats 89% of the people who took the test, it clears the median at a long list of well-regarded public universities, and it is inside the published band at many more. The work left is not mostly about the number. It is about reading published ranges correctly, checking how many students stood behind each one, and deciding school by school whether the score helps.
If a retake is on the table, make it a decision about scholarship thresholds rather than a vague wish for a bigger number. And if you do retake, spend the first week on error analysis rather than fresh tests, because at 1350 the points are already in the papers you have.
Ready to turn a prep plan into real score gains? Catalyst's 1:1 live online SAT programme starts with a free consultation to benchmark your teen's starting point and build a personalised path to their goal score.
Book a Free ConsultationSources checked 14 October 2026: College Board Research, SAT Nationally Representative and User Percentiles; NCES College Navigator, Fall 2024 entering-class admissions data.